Essays
New Tools for Clio: GIS, Railways, and Change over Time and Space in France and Great Britain, 1840-1914 1
Even Hercules might have groaned at working up a large GIS database, for the task typically
requires a team of researchers and assistants to carry the project through years of work. Is such toil
worth the effort? The answer, I think, is yes, provided that we practitioners move beyond data
construction to produce interesting and substantive results. In the historical realm of the digital
humanities, such results can open new understandings of great complexity, namely historical
change through time and geographic space. To make the case in this essay I draw on findings from
my comparative investigation into the effects of railways on rural development and cultural change
in France and Great Britain from the 1840s to the eve of the Great War. At the core of my approach
is the blending of history and geography. Such a blending used to be part and parcel of the
historian's craft, but nowadays when historians speak of "spaces" and "sites," most are speaking
metaphorically or referring to indefinite locations of discourse and cultural practice. This pattern
and the accompanying rise of cultural history perhaps explain why during the last decade or so
articles addressing geographic issues are as rare as hen's teeth in leading historical journals, and
neither "geography" or "spatial" have appeared in The American Historical Review's topical
indexes. Hence, I have a two-fold aim in this essay. In addition to validating historical GIS, I want
to persuade historians to re-engage with geography and to bring spatial thinking and analysis to their research and teaching.
Given that geography matters, how does that translate into the practice of history? Of the
many definitions of geography, the one I like comes from human geographer Doreen Massey:
geography is the study of social relations in space and time.2 The study of changes simultaneously
unfolding over geographic space and historical time is certainly a tall order, but one surely worth
pursuing because this helps us understand the past more clearly. Another key element of geographic
thinking is the recognition that spatial relations are dynamically interconnected. Spatial units—neighborhoods, towns, regions and the like—are defined in relation to one another and at
different spatial scales of resolution, i.e., local, regional, national, international, and global. Units
of similar size are linked horizontally as in a web of social relations that arise, for example, from intermarriage and
migration among a cluster of localities. Units of different size are connected vertically in hierarchies
such as local, regional, national, and transnational markets for goods, labor, finance and so forth.
This spatial connectivity is also dynamic, meaning that change in one part of a spatial system will tend to alter other parts of it.
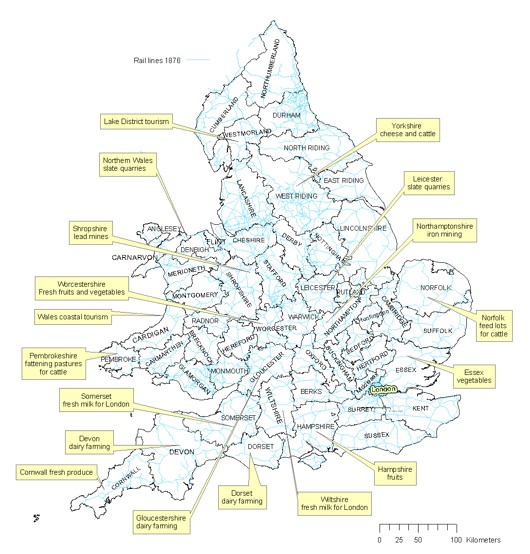
To make this concrete, consider the effect of rail transport on the spatial restructuring of
agriculture and the expansion of mining in Victorian Britain. In the provision of cattle for London,
Middlesex farmers had long enjoyed the advantage of being close to the capital. By the 1870s,
however, the expansion of railways into the western counties of Gloucestershire, Wiltshire, and
Pembrokeshire (Wales) and to the West Riding of Yorkshire in the north eliminated the home
county advantage because economical rail transport and lower costs for land and labor allowed
distant farmers to send large numbers of live animals to London at lower prices.3 Regional
specializations in the vegetable, fruit, and fresh milk trade were also prominent in the restructuring
of agriculture. As for rural industry, the growth of railways made possible the expansion of mining
in hitherto remote regions in the Midlands and northern England, and in southern and northern Wales. The geography of these developments is displayed in Map 1.4
Map 1
Across the Channel in France, expanding rail transport prompted a shift from regional self- sufficiency via mixed farming to regional specialization, a change especially marked in fresh produce, wine production, and cattle and dairy farming. As in Britain, rapid rail transport transformed the fresh milk trade, enabling distant producers to the meet the growing demand for milk in Paris, Lyon, and other urban markets. In the remote Burgundian village of Montigny-sur- Vingeanne (population 750), for example, the Guillot brothers did business in regional and national markets for milk. Their dairy represented a beginning link in the commodity chains that connected geographically-dispersed dairy farmers, carters, and milk-can makers to shippers in market towns, to distribution centers such as Dijon, to wholesalers and retailers in Paris, and, finally, to a glass of milk in the hand of Parisian consumers seated at the family table. There, the brothers hoped, talk of milk from the Vingeanne would fix in the minds of consumers a mental association of their product with farm-fresh quality and good health. To realize their hope, they commissioned an eye-catching poster to communicate their message to more and more urban clients. For distant consumers who got the point, Montigny-sur-Vingeanne in the Cote d'Or department was a place that, even if they never visited it, likely registered in their geographic imaginations. Such was one way that social relations and cultural meanings changed during the Railway Age.
To get a sense of the underlying transformation that led to the Guillots' marketing of Vingeanne milk on a regional and national scale, an animation showing the development of the French rail system from 1830s proves useful. In viewing the animation, a few questions ought to be borne in mind: Where and when did rail service arrive in different parts of France? And why was that so?
Animation 1. Railway Development in France, 1830-2000
(Click on the map to start; click again to stop. Red segments represent new lines opened in a given year.)
--Animation not yet available--
We can better grasp this unfolding pattern by freezing a number of frames and using a set of static maps to study key moments in the story. (See Map 2.) Up to the early 1840s, the first stage of railway construction grew from local initiatives. Thereafter, a national system came into being under the French government's direction and through the planning and oversight of government engineers in the Bridges and Roads Department (Pont et Chaussées). By design, therefore, a radial network was constructed whose main purpose was to link regions and cities of economic importance with Paris. This overriding aim, together with the vast amounts of capital required to build railways, produced a network with huge regional disparities in rail service—disparities that would come to narrow in time due to political will in Paris reinforced from below by lobbying from agricultural syndicates, chambers of commerce, legislators, and local governments. In this evolution, it was only in the 1870s that new lateral lines outside the radial network begin to provide inter- regional rail connections that did not pass through the capital.
Map 2. Five Stages in French Railway Growth

By 1890, eighty to ninety percent of the French rail system was in place. Nevertheless, recognized disparities of rail service and associated economic benefits were far from being eliminated. As is evident in a carefully drawn military map of the system in 1890, the geography of the rail network represented a history of uneven development up to that point. The nature and structure of regional disparities become clearer by using a statistical technique and mapping the results. In Map 3 the clusters in red indicate privileged regions that enjoyed exceptionally high rates of rail transport as measured by the density of rail lines in any given district (canton). Conversely, clusters in blue represent contiguous districts with exceptionally low levels of rail density/rail service. By and large, this pattern conforms to the north-south divide in French economic history. The favored districts were more numerous in the developed North above a line running from Saint Malo in Brittany through Chalons-sur-Saône (south of Dijon) to Geneva (Switzerland). Below the line were the disfavored regions in central Brittany and the less- developed South. In the South two clear exceptions stand out. Bordeaux, a port and entrepôt for the high quality wine trade, joined the Montpellier-Marseilles area as places in the Midi that were unusually well provided with rail service. A hub for the trade in mass-market wines with large port facilities in Marseilles near at hand, the Montpellier-Marseilles region connected world and regional markets to Lyon and the North via a regional junction of lines at Chalons-sur-Saône. In additional to the Paris region itself, railways were especially dense in the northeast, as was the agglomeration of industry and highly productive agriculture running from Paris to Lille and Calais. Tours and the textile center of Evreux were also well served.
Map 3. Uneven Development in France:Regional Disparities in Rail Density by Canton, 1890 (results of calculating LISA statistics, local indices of spatial auto-correlation)

Apart from more obvious economic and political reasons for these disparities, factors easily overlooked in other approaches can be considered by using functions of GIS. Assessing the effect of topography, for instance, brings to light the way in which some regions in the south were victims of challenging terrain and an associated history of poor communications and sparse capital investment. Map 4 tells the story. It displays the rail lines existing in 1890 overlaid on a digital terrain model and classifies the slopes of the terrain over which lines had to pass. Until the 1860s, when technological improvements such as steel rails, more powerful locomotives, and effective coupling systems took hold, the hilly and mountainous regions of the Massif Central, Pyrenees, and Alps were deemed either as inaccessible to steam-powered locomotion or as areas in which construction costs were prohibitive. The map for 1890 shows that the extension of railways into upland areas had moved forward but had yet to reach large mountainous areas of the south.
Map 4. Topography and Rail Lines in 1890

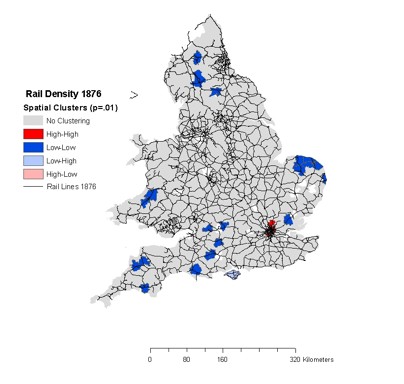
A comparison with Britain, the early leader in railroad development and only a quarter the size of France, shows how the conquest of national space and rugged terrain began at an earlier date and proceeded at a quicker pace. By 1876 the rail system in England and Wales reached nearly every district of the country, urban and rural. Compared to France in 1890, clusters of underserved English and Welsh districts in 1876 were sparse and scattered in agrarian regions of the north, southern Wales, the southwest, and East Anglia. (See Map 5.) Not surprisingly, the industrial North (e.g., Manchester) and Midlands (e.g., Birmingham), were well endowed with rail transport but, statistically speaking, only greater London exhibited an extraordinarily high level of rail service.
Map 5. Uneven Development in Britain: Regional Disparities in Rail Density by Census Registration District in 1876 (results of calculating LISA statistics, local indices of spatial auto-correlation)
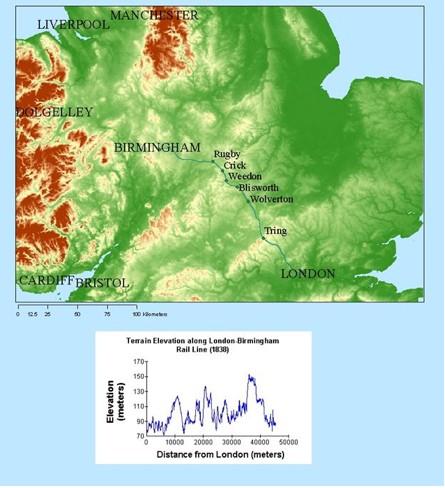
The railway's conquest of rugged terrain in England and Wales began in the 1830s with the construction of the line from London to Birmingham, rightly deemed a marvel of engineering when it opened in 1837. Recognizing the limits of steam locomotion at the time, the builder, Robert Stephenson, kept the line to an average ruling gradient of 1 to 330—one unit of rise over 330 units of linear run. To maintain that shallow grade over some 100 miles of valleys, hills, and gorges required vast excavations at Tring, Wolverhampton, Blisworth, and Kilsby.5 (See Map 6.) The profile of the route, below the map, displays both the general rise of the landscape between greater London and Birmingham and the prominent peaks at four or five places along the way.
Map 6. The Route and Terrain of the London to Birmingham Railway, opened in 1837
In the 1860s, technological improvements enabled railway companies and their engineers to push farther into rugged, remote areas. The most striking developments of this kind took place in Wales. Whereas up to the 1850s the few Welsh railways in operation circumvented the interior uplands of the principality (Map 7), many of the new railways opened in the 1860s and 1870s (Map 8) successfully navigated the hills and mountains of the region. New lines in the south knit together the great collieries in the valleys near Swansea, while those in the central highlands connected agrarian areas with coastal ports, the southern coal fields, the northern slate mines, and, to the east, the rail system in England. The railway linking Wales with England that ran from Ruabon to Barmouth was constructed over terrain considerably more challenging than that Stephenson had subdued some 35 years before. (See the profiles at the bottom of Map 8.)
Map 7. Skirting the Hills: Rail Lines in Wales up to 1855
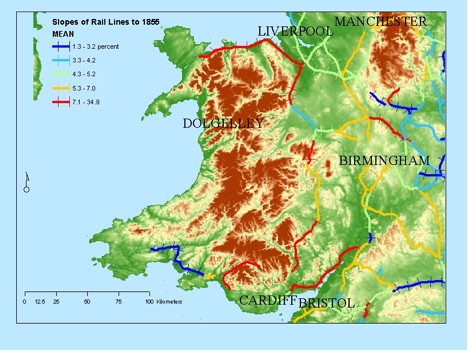
Map 8. Conquering the Hills: Rail Lines Opened in Wales, 1855-1876
The arrival of rail transport in rural France and Britain initiated a cycle of economic and social adjustment as local producers, craftsmen, and workers adapted themselves to changing market conditions. At first accessible rail service might well provide an economic shot-in-the arm by facilitating the marketing of local products and creating new jobs in agriculture, extractive industries, and service trades such as the horse-drawn carting of goods to and from rail stations. In villages so favored, out migration likely slowed and populations stabilized or grew. Such revitalization was apt to last a decade or two. Thereafter, railways, once the vehicle of expanding local prospects, brought intensifying national and international competition to the farm gate, the craftsman's shop, and the worker's cottage, reducing or eliminating previous gains. As national and then international competition in the grain trade intensified after the 1860s, grain prices fell. As factory-produced butter became an item of mass distribution, small rural dairies had to adjust. Faced with intensifying competition, farmers moved in various ways to reduce wage bills and maintain incomes. A shift from grain farming to stock raising, for example, substantially reduced a farmer's need for agricultural labor. In the affected rural communities, out migration rose and populations declined. Geographic thinking, spatial statistics, and geo-referenced data for England and Wales permit us to put this scenario to the test. To begin, it is useful to recall that population change over time has two components: natural increase (births minus deaths) and net migration (the net effect of movements into and out of any given district.) Net migration in this analysis measures inter- censual population change in all of some 630 districts into which England and Wales were divided for decennial census enumerations. Negative values of net migration represent the predominance of out migration over in migration; positive values, the prevalence of in migration over out migration.
Map 9 provides a snapshot of net migration at the end of the decade 1871-1881. As one would expect, population increases due to in migration were conspicuous in the urban agglomerations centered on London and those spanning the Liverpool-Manchester region in the northwest. In migration to the northeastern coal-mining region around Newcastle, having peaked in the 1860s, continued but was surpassed in 1870s by the vaster movements of people into South Wales where the coal industry was on its way to becoming the biggest in the world. In rural areas, the highest levels of out migration were located in the agrarian zones of southern England and central Wales. The affected districts lay within a band running from the tip of Cornwall in the southwest, to East Anglia and Lincolnshire in the East, with Central Wales and Gloucestershire forming an isthmus. The extent to which accessible rail transport tended to slow out migration from rural regions is visible in the lower window of Map 9. A result of a geographically weighted regression analysis, this display maps the coefficients for rail density and shows where and to what degree proximate rail service—measured by rail density by district—likely reduced out migration.
Map 9. The Effect of Rail Density on Net Migration in Registration Districts of England and Wales in the 1870s.
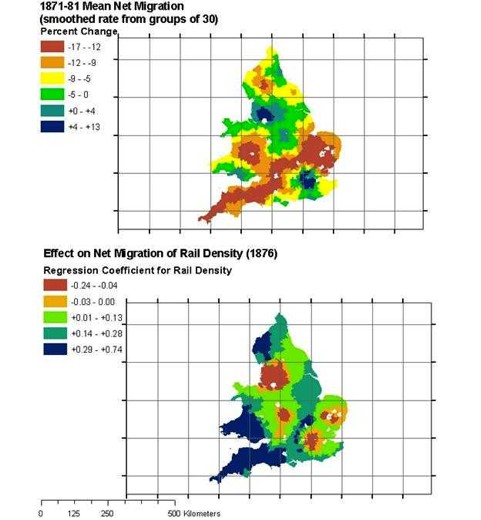
Clearly, the effect of rail transport on net migration varied considerably by region. In urban agglomerations centered on London, Birmingham, and Manchester, rail density was inversely related to net migration, suggesting that population increases from in migration were lower where high or extremely high levels of rail service were in place. The same pattern held true in parts of East Anglia south of Norwich.
Elsewhere (green and blue areas) a positive relationship was at work and of greater or lesser magnitude depending upon the region. The retarding effect of rail service on net migration appears to have been greatest in the areas shaded dark blue: in the rural districts from Bristol to Penzance in the southwest, those in a band to the north and west of London, others in the far northwest, and still others in a Welsh triangle covering parts of the central region and all of the south. A conclusion thus suggests itself. During the 1870s in rural regions that were already loosing population through out migration, the accessibility of rail transport tended to diminish the rate of rural depopulation to a degree that varied geographically. The retarding effect was greater in parts of central and southern Wales, the Southwest, and the far Northwest. During a decade when agrarian distress was beginning to appear, especially in grain-growing regions, the commercial benefits of proximate rail service in rural communities arguably diminished the migratory tide, reducing the rate of rural depopulation in different places to a greater or lesser degree.6
In concluding, I want to underscore the difference between historical GIS as a collection of geo-referenced data—as great an accomplishment it may be—and the new insights and understandings that can come from analyzing that data. Focusing on the crucial role of analysis and interpretation, this essay illustrates the need and the benefits of blending historical and geographical thinking. Technically, the methods used here are those of ESDA—exploratory spatial data analysis—applied to search for patterns over time and space. The aim of the investigation is not to treat the average of the phenomenon under study—be it the aggregate effect of rail transport on the French economy or the average degree of rail transport accessibility among all rural districts. Rather, the aim is to identify variations, anomalies, and disparities in rail transport at local and regional scales of resolution. With these disparities gauged and mapped, we can then examine where, when, and to what extent they were reinforced, modified, or diminished by the effects of topography, technology, state policy and other factors. In this way the study of geo-referenced data through mapping, visualization, and spatial statistics helps usdiscover new understandings of historical change. One new understanding in this essay, for example, is the retarding effect that proximate rail service had on rural out migration in certain regions of England and Wales during the 1870s.
To my mind, these new discoveries need to be joined with tried-and-true detective work in sources that tell us about lived experience and shifting cultural perceptions. The ever-so-brief example of the brothers Guillot in out-of-the-way Montingny-sur-Vingeanne points to the promise of what I call "narratives of place." When situated within regional and national patterns—transport, communications, population, topography, and so forth—narratives of specific places can avoid pitfalls of usual case studies and the a spatial indefiniteness of mere "sites" of cultural practice. Appropriately contextualized with the aid of GIS and spatial analysis, they can describe and distinguish common and uncommon experiences in everyday life; they can suggest variation in cultural changes and in local, regional, and national identities, in the awareness of events and jobs beyond the sound of the village bell, and in mental pictures and the imagined geography of distant places not seen first-hand. All this—GIS, historical and geographic thinking, spatial analysis, and historical detective work—will help us tell better describe the varied histories of people in specific communities, and of the changing world of the Railway Age in which they lived. Used as a complementary tool of our craft, historical GIS is indeed worth the effort.
1 I wish to thank the Pauley family for endowing a symposium that permits historians to collaborate in addressing a theme of major interest. Thanks also to the University of Nebraska organizers: to William G. Thomas for inviting me to participate, Douglas Seefeldt for welcome guidance about the program, and Kim C. Weide for making the travel a breeze. The writing of this article was supported by a Collaborative Research Grant from the National Endowment for the Humanities. Parts of the article draw on research described in detail in a longer article submitted to The American Historical Review with co-author Ian Gregory and a shorter piece that recently appeared in The History Teacher, 29 (May 2006), "Teaching Environmental History: Environmental Thinking and Practice in Europe, 1500 to the Present."
2 Doreen B Massey, Spatial Divisions of Labor, Social Structures, and the Geography of Production, 2nd ed. [1st ed. 1984] (New York: Routledge, 1995).
3 Richard Perren, "The Marketing of Agricultural Products: Farm Gate to Retail Store," in E.J.T. Collins, ed., The Agrarian History of England and Wales, 2 vols. (Cambridge: Cambridge University Press, 2000), II: 973-74.
4 The rural developments shown on the map come mainly from two works: David Turnock, An Historical Geography of Railways in Great Britain and Ireland (Brookfield, VT and Aldershot, Hants, England, 1998): 273-73, 280-81; and E. J. T. Collins, "Rural and Agricultural Change," in Collins, ed., The Agrarian History of England and Wales, Vol. 7, I: 138-40, 146-49,158-67.
5 At Tring, there was a huge cutting, 2.5 long and up to 40 feet deep; at Wolverhampton, an equally imposing embankment led to a second cutting at Blisworth that ran 1.5 miles and up to 60 feet deep. Finally at Kilsby a long tunnel served to flatten out the roadway from Crick to Rugby (Simmons and Biddle 1997, 135, 426). For contemporary images of these earthworks, see my article, "Teaching Environmental History: Environmental Thinking and Practice in Europe, 1500 to the Present," The History Teacher, 29 (May 2006): 339-43.
6 For a fuller analysis, see my forthcoming article with Ian Gregory in The American Historical Review, "History/Geography: Railways, Uneven Geographic Development, and Globalization in France and Great Britain, 1830-1914." The geographically varying relationship between rail density and net migration was statistically insignificant in the 1860s, which one would expect because of the limited penetration of railways into the countryside at that time. Significant in the 1870s, the relationship was also significant in the decade 1881 to 1891 when the agrarian crisis (1873-1896) was in full swing. At the end of that decade, the retarding effect of rail density on rural out migration exhibited a geographic distribution that differed somewhat from that of the 1870s. As the following map indicates, the effect diminished in Central Wales, Cornwall, and Devon; disappeared in most of East Anglia and in Northern Wales; and expanded in East Midlands and districts in the south-central counties of Oxfordshire, Berkshire, Wiltshire, and Hampshire.