Essays
Creating the China Historical Geographic Information System
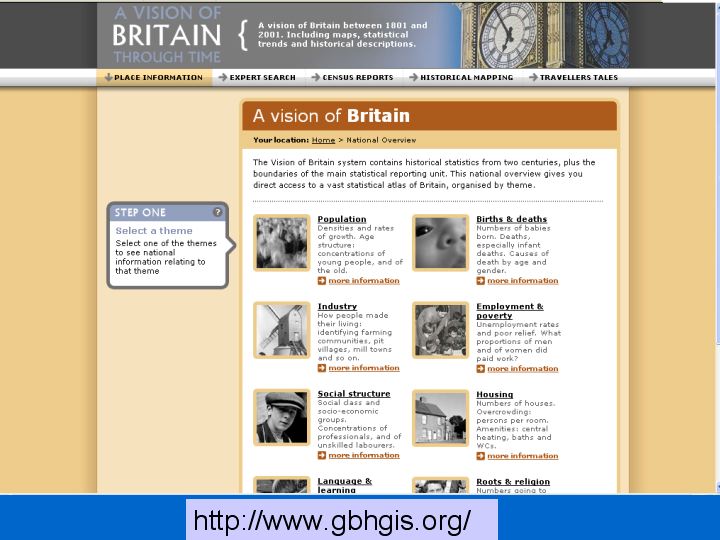
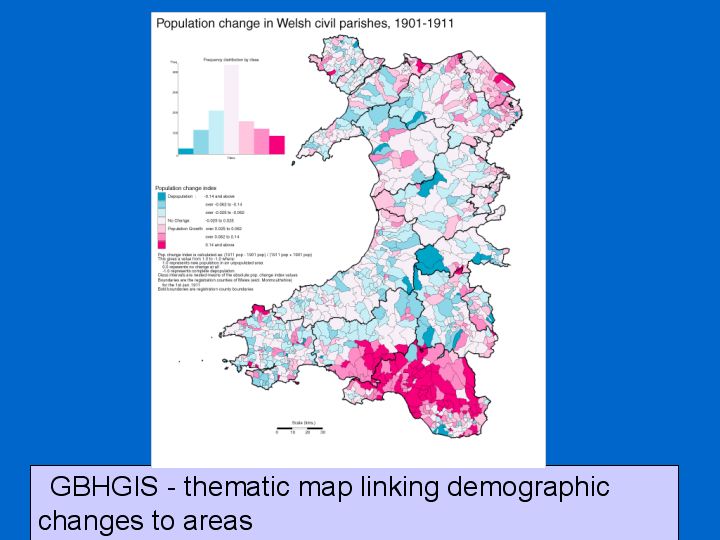
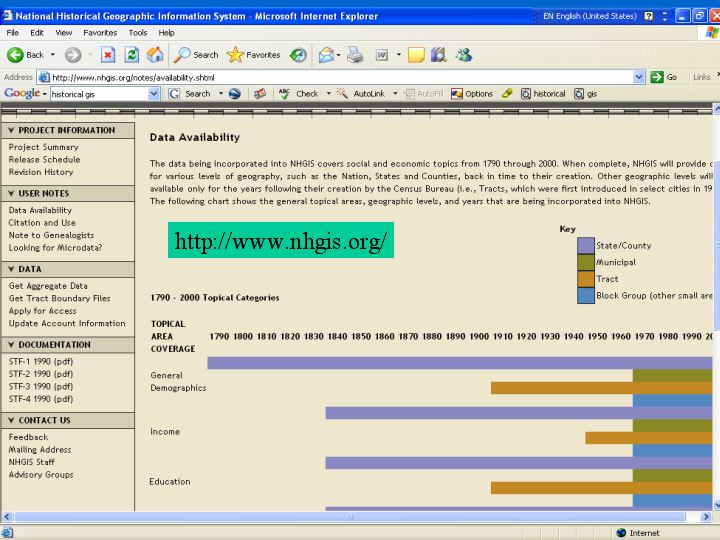
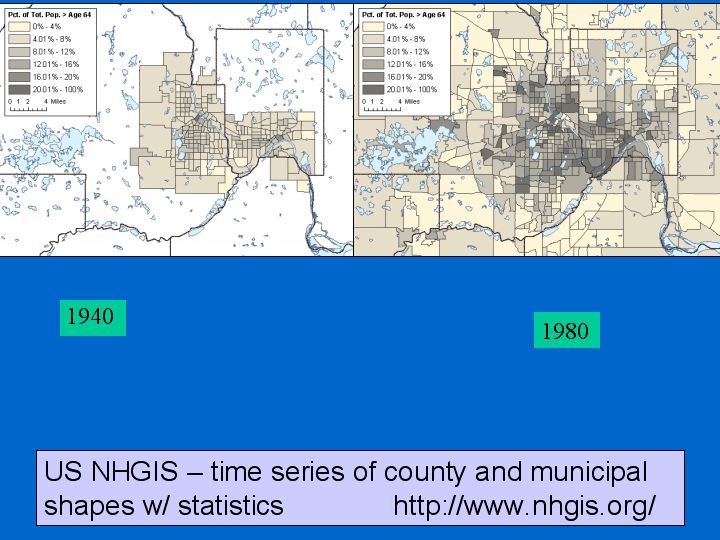
The China Historical Geographic Information System (CHGIS) [slide 2] project is one of a number of national historical GIS projects. The earliest and most advanced is the Great Britain Historical GIS [slides 3-4], and the United States Historical GIS (the "National Historical GIS") [slides 5-6] is developing quickly.

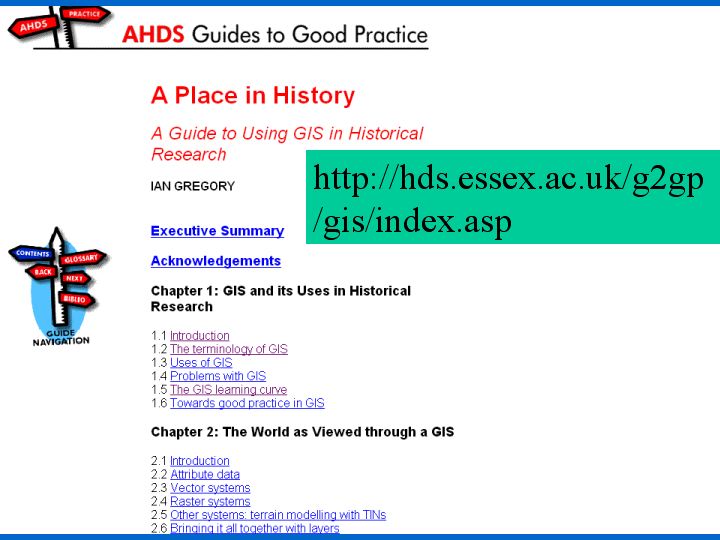
Useful guides to historical GIS are on the web [slide 7] and Anne Knowles has edited and published one collection of historical case studies, with a second forthcoming.1
There is a distinction to be made here. Ever more frequently scholars are creating a GIS to apply spatial analysis to a particular historical subject; but a national historical GIS, such as those for the Great Britain, China, or US, are infrastructural GIS. Like a national map they provide a context in which a plethora of local maps can be located and they provide users with the means to generate local maps.
The Basics of an Historical GIS
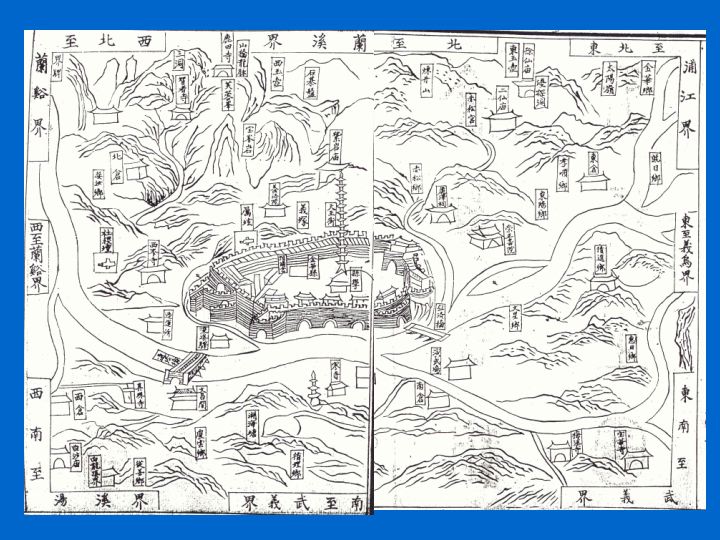
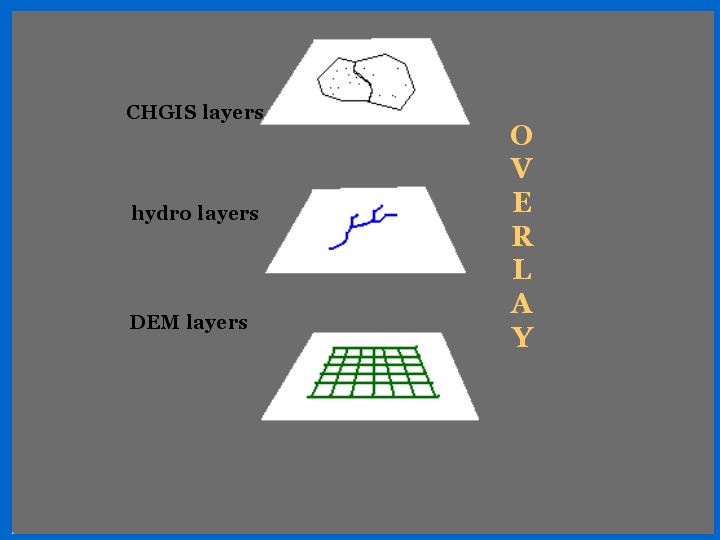
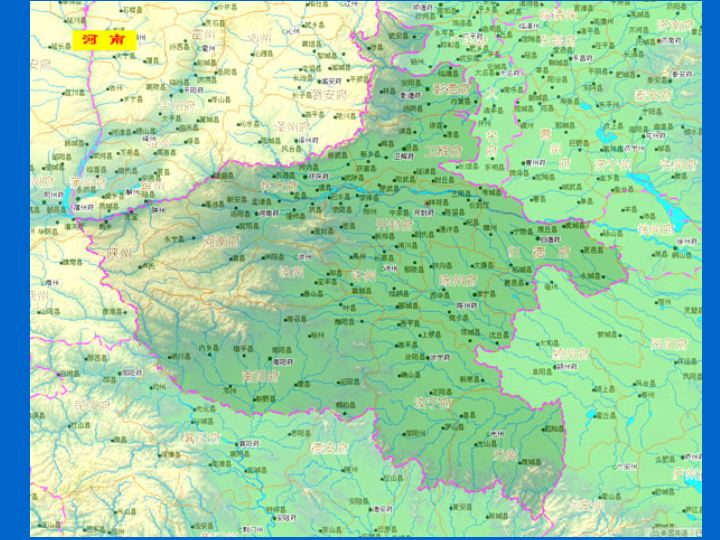
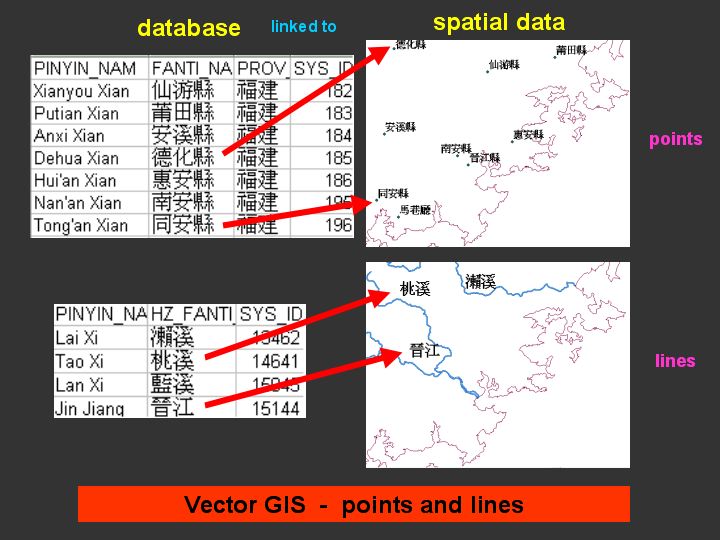
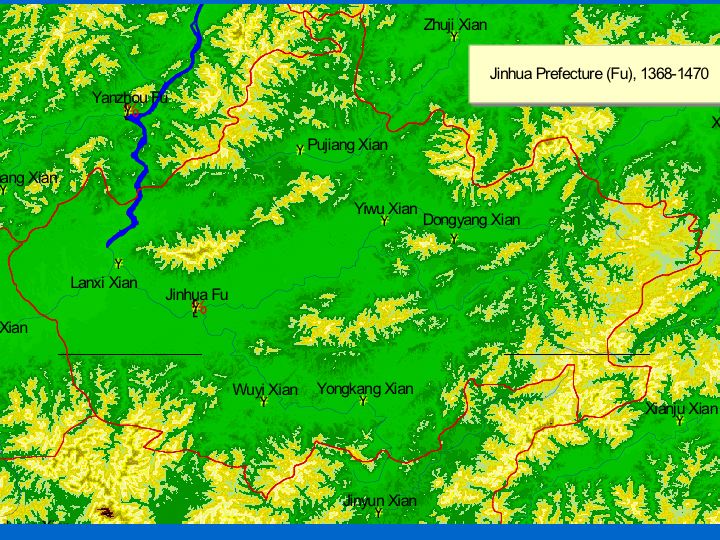
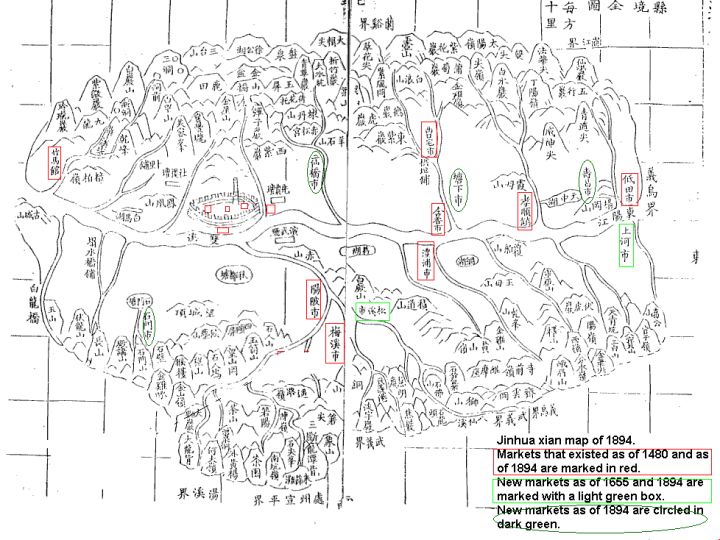
An easy—but misleading—way to understand a GIS is to think of it as a map. Indeed the origins of GIS lie in the early attempts to use computers to create maps2 and the map is usually both the user interface with and the output of a GIS. A map, as in this 16th century example (Jinhua County, Jinhua Prefecture, Zhejiang Province, Country of Great Ming) [slide 8], is usually an aggregation of different kinds of data: rivers, mountains, temples, cities, the county seat, administrative districts, and so on. A GIS usually disaggregates, treating each kind of data as a distinctive layer, and often bringing together layers from different sources.
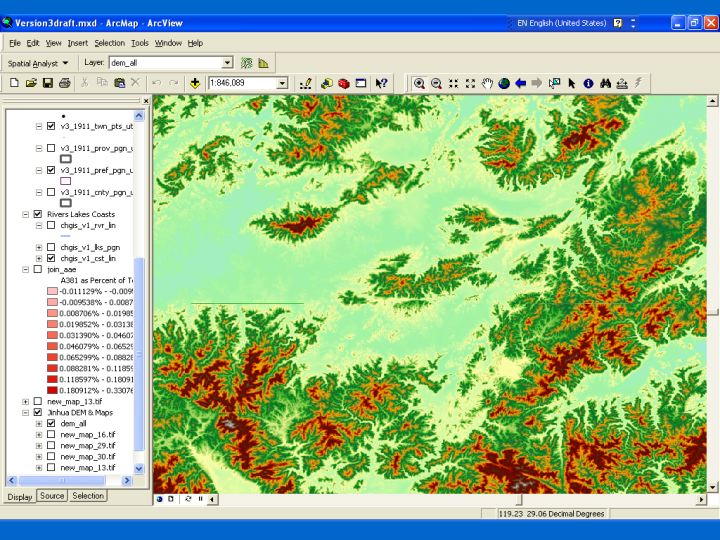
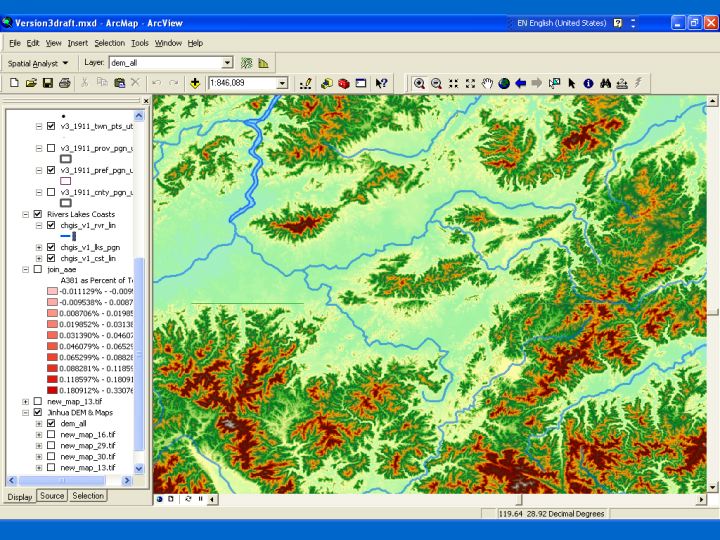
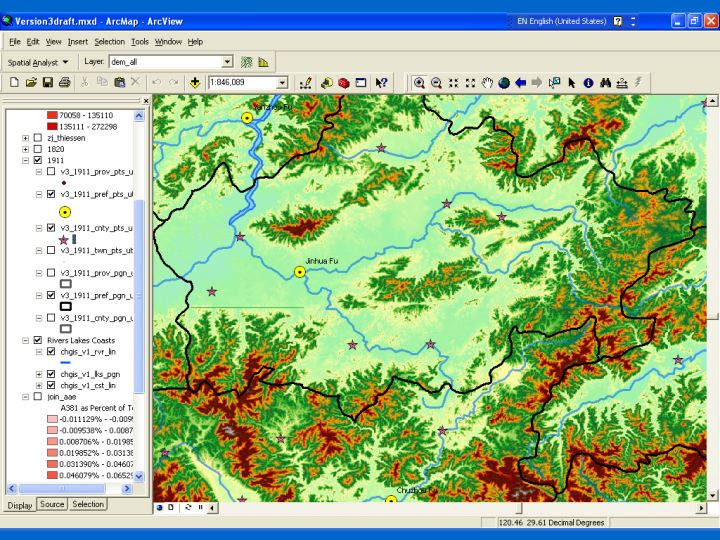
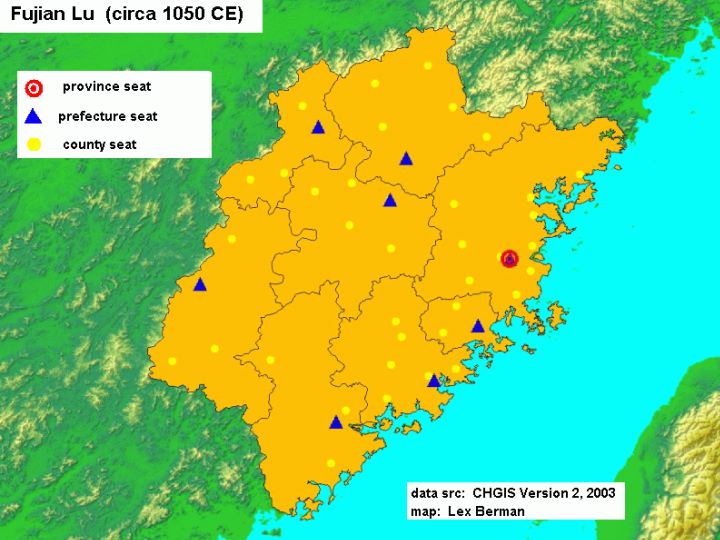
Thus, for example, a GIS version of the same place for the same time can bring together a digital elevation model (DEM) based on remote sensing imagery, lines to represent rivers and points to represent administrative seats with polygons for prefectural units [slides 9-12]. Conceptually there may be no difference, but from the user's perspective the difference is enormous. We get to turn the layers on and off, to change their color, shape, size, and shading.
Maps lie not only because they must distort to convey significance but also because the representational choices they make obscure, sometimes unwittingly, other possible significances.3 A GIS has the "advantage" that it allows us to lie in multiple ways; its lies are not fixed by the printing process. A GIS makes it possible to contrast different perspectives. There is another difference, which explains why a GIS can do this. A GIS is in fact a database with multiple datasets. Certainly the printed map is supposed to be based on data, but very rarely does it provide the raw data that supports the map. A GIS can—a point I shall return to—and it allows us to change data and add data. Finally, a GIS involves software, and today the software comes with a variety of analytic tools, allowing one to measure distance, area, degrees of proximity, and much more. One can do statistical calculations and generate charts. In fact making full use of the spatial analytic tools built into current software packages require considerable training or technical assistance—I shall give an example at the end of this paper. And of course one can use GIS software to create maps. Cartographic techniques are sophisticated; viewers learn to read maps but few researchers or teachers have in the past been able to produce geographically accurate maps on their own. Now they can [slides 13-15].
Historians have long used maps to plot spatial relationships. GIS serves the same purpose, whether to show voting patterns, analyze the disposition of forces in a battle, or plot the distribution of religious establishments. As with paper maps, we can use GIS to ask the question: What was the situation at a particular moment in time?
An historical GIS creates datasets correlated with spatial representations [slide 16] in which all of the geographic features are explicitly dated, or time-stamped, so that they can be retrieved based on time-based query parameters [slide 17].

This approach makes it possible for users to ask both: "what was the situation at a specific time?" as well as: "how did the situation change over time?" It allows the user to compare data that is place specific and time specific and to visualize the data as maps which are snapshots for selected points in time.
The value of GIS in historical studies is multifold. First, GIS enables the user to correlate historical data they have collected to reliable locations on the ground, rather than having to plot them by hand on tracings of paper maps. Second, the data that have been saved in GIS layers with defined projections can be shared and re-examined by anyone else who has access to the appropriate software (the simplest of which is a free downloadable viewer). Third, the data that have been stored in GIS layers, can be visually compared with any other type of GIS data, from global coverages of river systems to transportation networks, elevation models, land-use maps, administrative boundaries, and so on. Fourth, any combination of the GIS layers can be utilized to perform various kinds of spatial analysis, such as proximity relationships or geostatistical calculations based on user-defined algorithms. Finally, GIS allows for tremendous flexibility to produce maps from multiple data layers or directly from the results of spatial analysis.
Many of the advantages of using a GIS are practical$mdash;they allow users to do on their own what they could not do before, and at minimal cost. Some historians have begun to use GIS to go beyond mapping their data to analyze the spatial relationships in the data, showing connections that earlier scholarship had missed. For example Goeff Cunfer has been able to challenge Donald Worster's argument that the "dust bowl" of the 1920s and 30s was the result of over- plowing. Cunfer has combined land-use and meteorological data with dust storm records and archaeological data to show that dust storms were primarily a consequence of drought and did not result from plowing. Amy Hillier's construction of a GIS that combined real estate grading maps with the exact location of bank loans has allowed her to challenge the claim that banks refused mortgages in "red-lined" districts.4
The China Historical GIS project
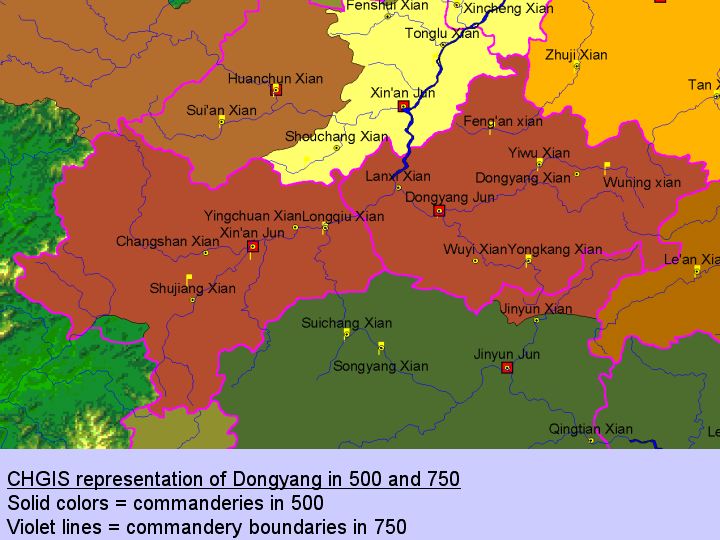
Our goal has been to create an authoritative base GIS for the study of China's imperial history. By "base" GIS we mean that CHGIS must serve as a common foundation, the base-map so to speak, for the analysis of a wide variety of data with spatial attributes: population, tax, land use, religious sites, physical geographic features, biographies, military campaigns, and so on. A group of senior historical geographers at the Center for Historical Geography at Fudan University, Shanghai, are creating a record of administrative structures beginning with the creation of a centralized bureaucratic empire in 221 BCE (and the beginning of national administrative geographies). Each administrative unit that is known to us from the historical record is entered into the CHGIS database. All the changes in administrative units over time are also stored in the database, changes resulting from both internal reorganizations and the rise and fall of competing regimes [slides 18-20].

The justification for adopting the administrative hierarchy as the basis for a common GIS is that, first, administrative units are the most common spatial attribute of data in the historical record and, second, data were generally collected and reported through the administrative hierarchy.
CHGIS thus differs in a number of ways from the other national historical GIS projects.
1. CHGIS is creating a platform which users can use to project and analyze their own datasets, by adding or joining them to the CHGIS datasets. In contrast to those projects which see the GIS as a vehicle for providing georeferenced census data, we are not (at the moment) engaged in creating datasets with other variables. Our hope, however, is that scholars will see the value of creating datasets and sharing them with others. After all, the value of a GIS lies in having access to as many datasets as possible.
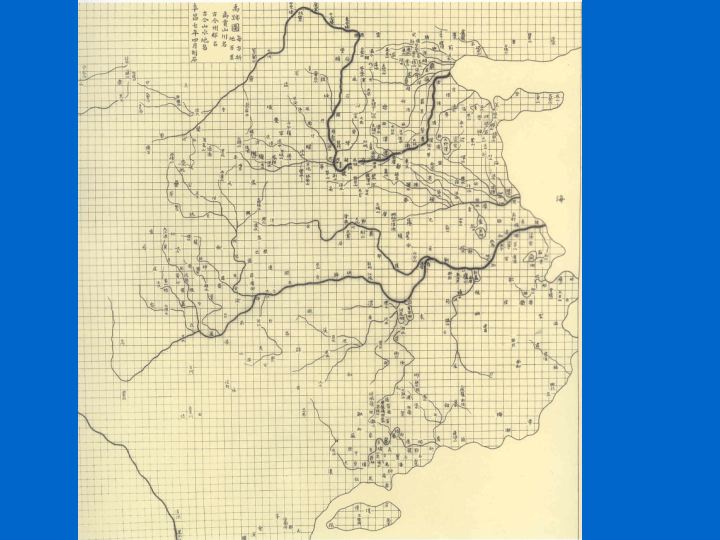
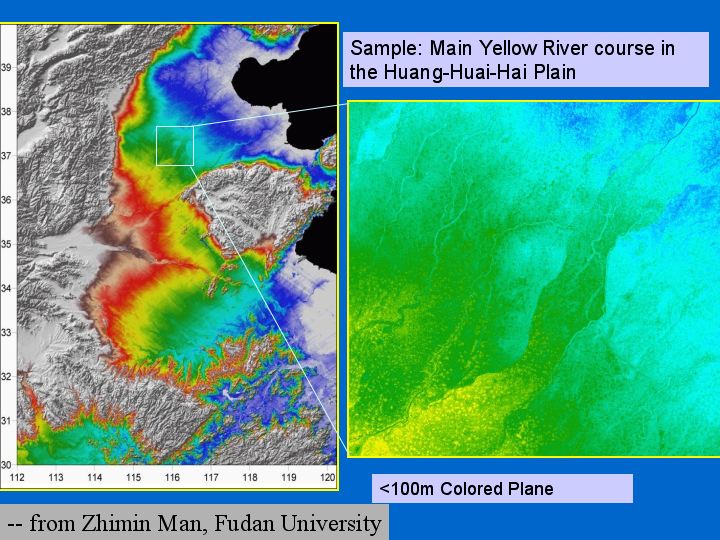
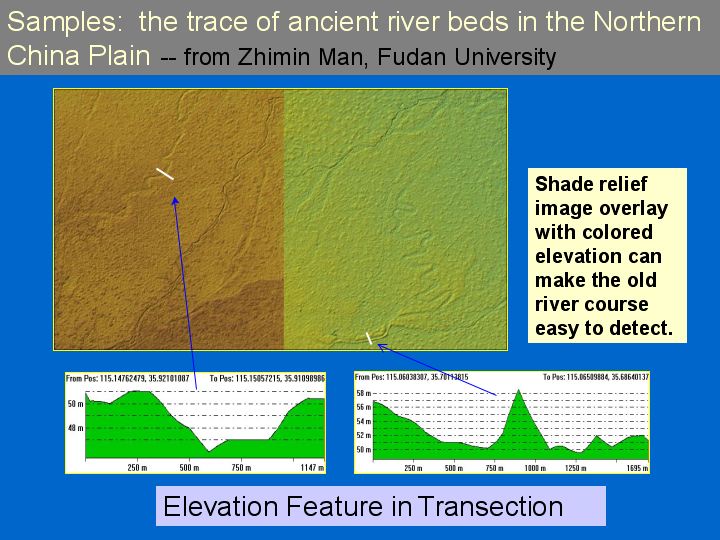
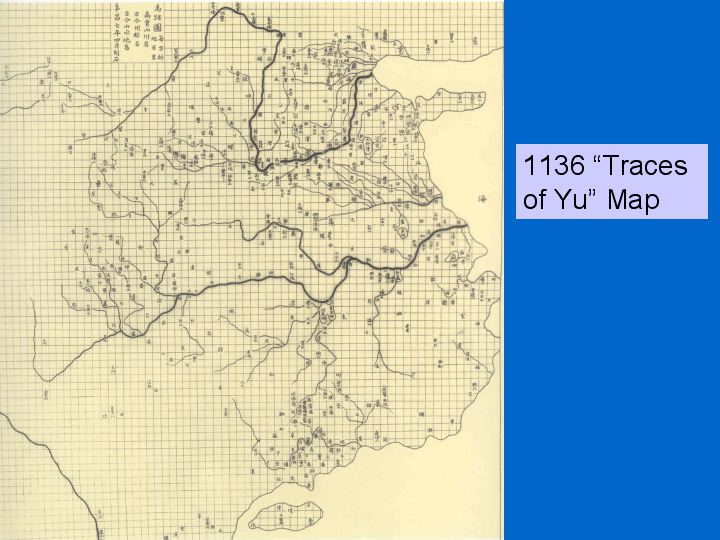
2. CHGIS aims to cover all of imperial history, from 221 BC to 1911 AD. Cartography which takes the curvature of the earth into account does not spread in China until the end of the 19th century. CHGIS is not dependent on having accurate paper maps and thus can go back in time. Extant maps, from as early as the 11th century on [slide 21], have reference value but are not exact enough for a GIS. Historical reconstruction thus depends working backwards in time, using textual research for the administrative system and textual and remote sensing data for changes in coastlines and rivers [slides 22-23].
The existence of accurate historical maps appears to still determine the historical coverage of other national historical GIS.
3. In a sense CHGIS is a historical GIS of many nations. A variety of dynastic states occupied the area roughly coterminous with the 18 "core" provinces of modern China. Some of these were created by nomadic conquerors from north of the Great Wall who initially did not speak or write in Chinese. Often the area was divided between contending states. The borders of these regimes were almost always in flux. Although CHGIS has focused its work on the core provinces (home to 90% of the population), the territory that needs to be covered changes over time as does the amount of historical data.
4. The kinds of data collected, the status of the those who collected data, and the way they were recorded and preserved changed over time; our sources for the south for the last millennium are far more detailed than for the previous millennium, or for the north before the 16th century.
5. Over two thousand years of time and thousands of kilometers of space the conceptualization of space changed. An historical GIS needs to represent space in a way that conforms to the approach to space in practice, an issue that will be addressed below.
The objective of the CHGIS project is to create an open-ended platform, which can be used as the basis for exploring the successive political systems through more than 2,000 years of China's history, and also to provide a means for the digital representation of their locations in space and time. In addition, CHGIS provides a means for statistical datasets (such as population, tax, land-use, or other data) to be added for particular periods and areas of interest, allowing users to store, search, compare and analyze their own data in relationship to numerous other types of data within a single unified framework.
The Creation the CHGIS Datasets and Source Notes
The core content of CHGIS is being created by China's primary national center for historical geography, the Center for Historical Geography at Fudan University in Shanghai. Scholars there produced the most authoritative reference work for historical geography, the Historical Atlas of China.5 Many of the original editors of the Historical Atlas and a number of younger researchers are drawing on the research done for the Historical Atlas and conducting extensive new research as part of the CHGIS project. Their work, which is compiled into the new CHGIS database, goes far beyond what was represented in the Historical Atlas in its detail and exactness. [slide 24]
CHGIS is not a replication of the Historical Atlas. CHGIS has a continuous time series rather than particular moments in time; it takes into account far more primary sources and modern research; it specifies relationships to the administrative hierarchy; it provides longitude and latitude coordinates; it provides beginning and ending dates for all historical places; and it includes source notes. The completed work will supersede any existing historical administrative geography of China in terms of temporal range, spatial accuracy, and documentation of sources.
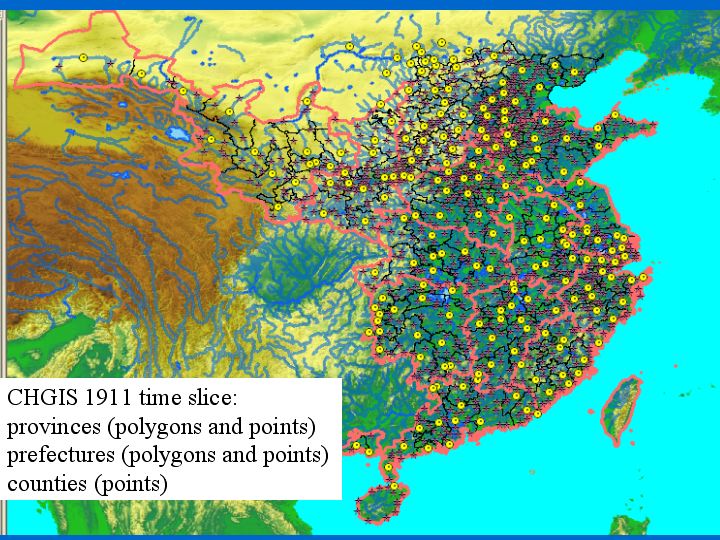
There are two distinct types of GIS layers in the CHGIS datasets: Time Slice data, [slide 25] and Time Series data. [slide 26]


Both are separated into separate layers for points, lines, and polygons; and within the point layers, there are separate layers for Prefectural Capitals, County Capitals, and Towns. The polygon layers are organized in the same way, with separate layers for Prefecture boundaries and, for 1911, County boundaries. However, Time Series data represent CHANGES in spatial objects as they occur over time and thus include overlapping spatial objects, each of which represents a valid instance of a place for a particular span of time. To use the Time Series data, it is necessary to first select out the objects of interest, either by name, type or by a particular time. A selection of objects valid for a particular time (for CHGIS the smallest resolution of time is one year) can then be manipulated in the same way as Time Slice data [slides 27-28].

All CHGIS placename records are compiled in English transliterations (Pinyin) and Chinese characters (both simplified and traditional). Currently the database contains placename records in several vernacular scripts: Chinese, Japanese, Russian (Cyrillic), and in several romanized forms: Pinyin, Wade-Giles, and Non-standard Variants. In this way the CHGIS database functions as a multilingual historical gazetteer, easily expanded to include any vernacular script that can be input with Unicode UTF-8 character set encoding.
Making CHGIS Data Available
The CHGIS project is committed to providing these base GIS datasets for Chinese history free for academic use to all scholars world-wide. The datasets are available for download from the CHGIS website in multiple formats.
As explained above the goal of creating a base GIS for Chinese history is to make it possible for users to project their data onto a digital map that accurately reflects the administrative structure for which the historical data is valid. By downloading the CHGIS base GIS, users can join their own datasets to it and create new data layers appropriate to their research. They can analyze that data, test hypotheses about spatial relationships, generate historical maps for research, teaching, and publication, and—because CHGIS provides an internationally available and authoritative platform—share their data with others.
At the same time CHGIS serves two other functions. 1. It provides an online historical gazetteer. Users may use CHGIS to find information about a specific place, to see when it existed, where it was, where it belonged in the administrative hierarchy, and what historical documentation exists for these findings. (see Appendix D for sample queries). This means that almost any place name found in historical texts can be accurately located. The CHGIS search engine, which functions as the primary historical gazetteer server, is a free, web based utility that currently receives thousands of search requests per week.
2. It is an electronic atlas. Because CHGIS has adopted a "continuous time series" approach - that is, it traces all known changes over time, so that users are free to decide which moment or moments they wish to view - it may be used as a source of maps of the known administrative structure and settlements of China for any year between 221 BCE and 1911 CE. Users can do this for themselves, generating maps as they need them, as in the examples used in this presentation.
Here I will briefly illustrate the capabilities of CHGIS, developed by the project manager Merrick Lex Berman [slides 29-43].
|
Slide 29 
|
Slide 30 
|
|
Slide 31 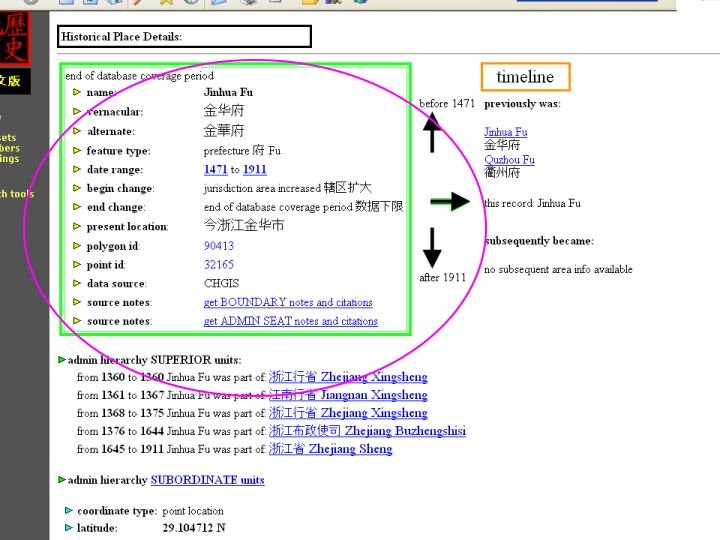
|
Slide 32 
|
|
Slide 33 
|
Slide 34 
|
|
Slide 35 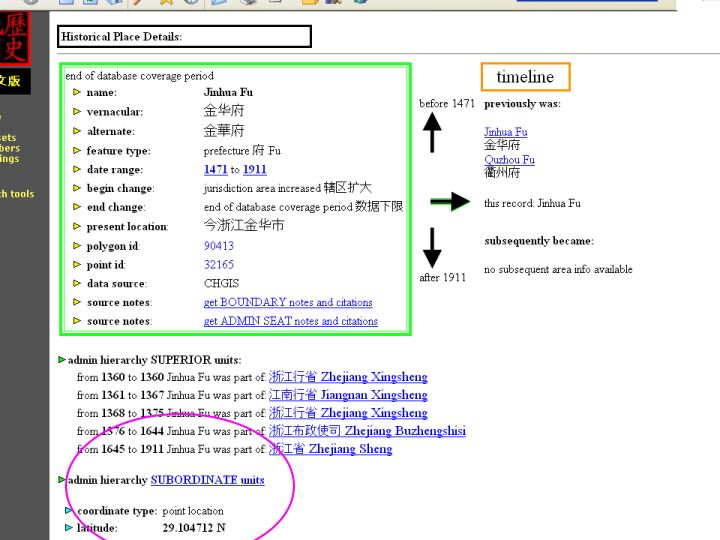
|
Slide 36 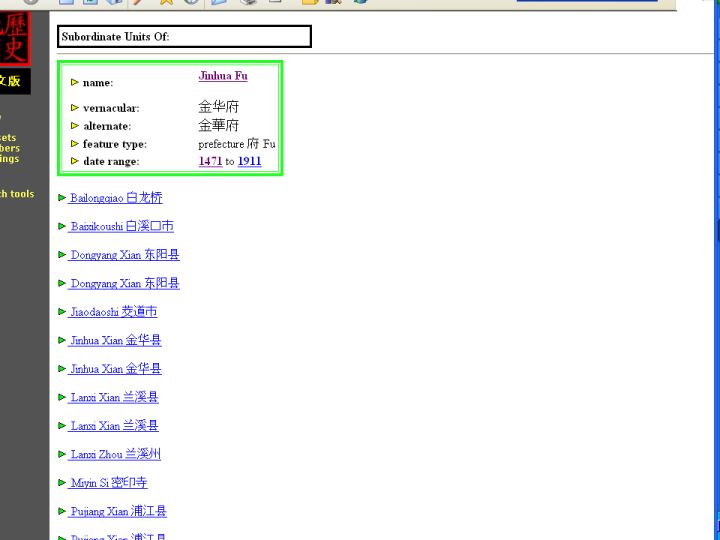
|
|
Slide 37 
|
Slide 38 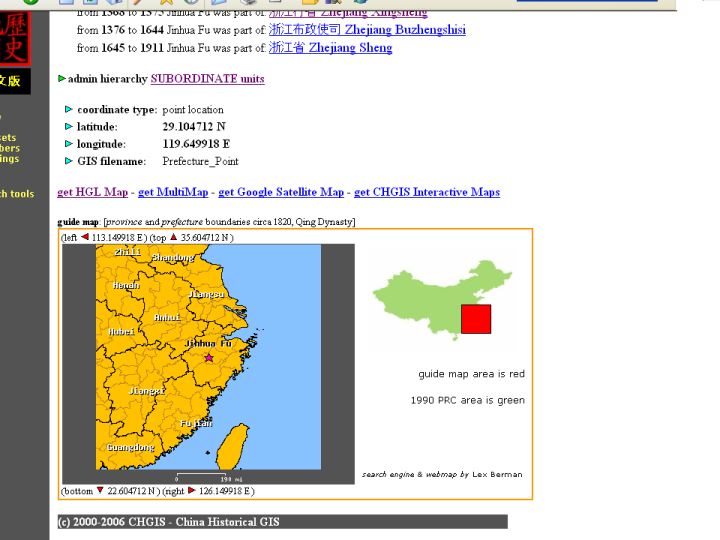
|
|
Slide 39 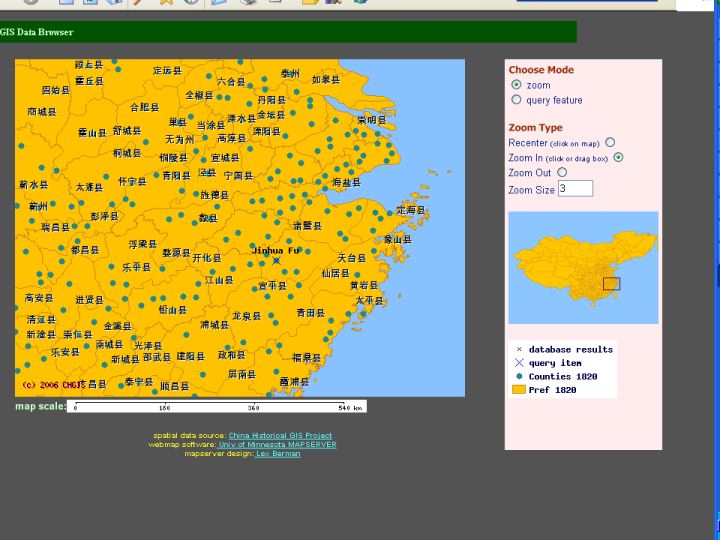
|
Slide 40 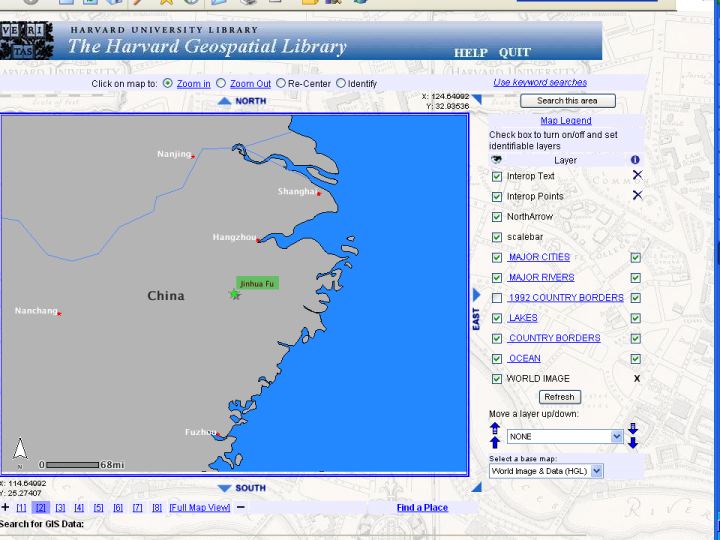
|
|
Slide 41 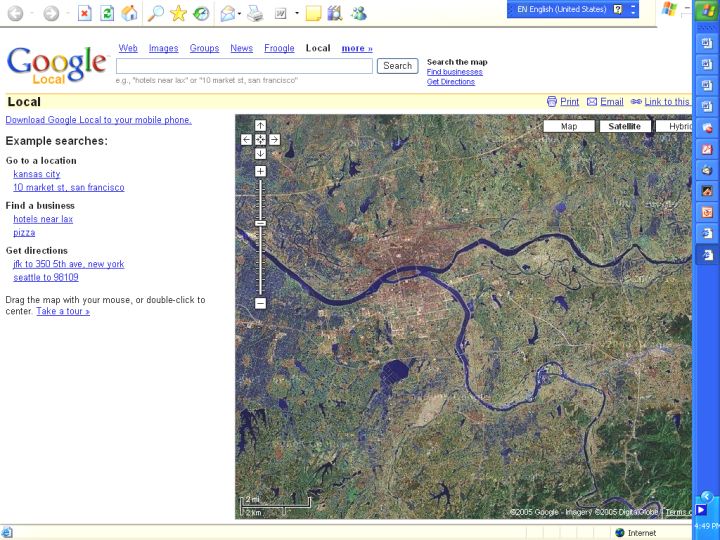
|
Slide 42 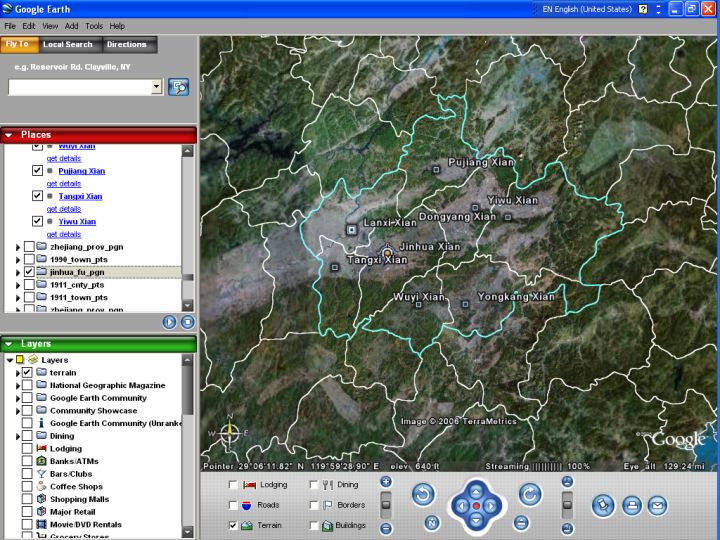
|
|
Slide 43 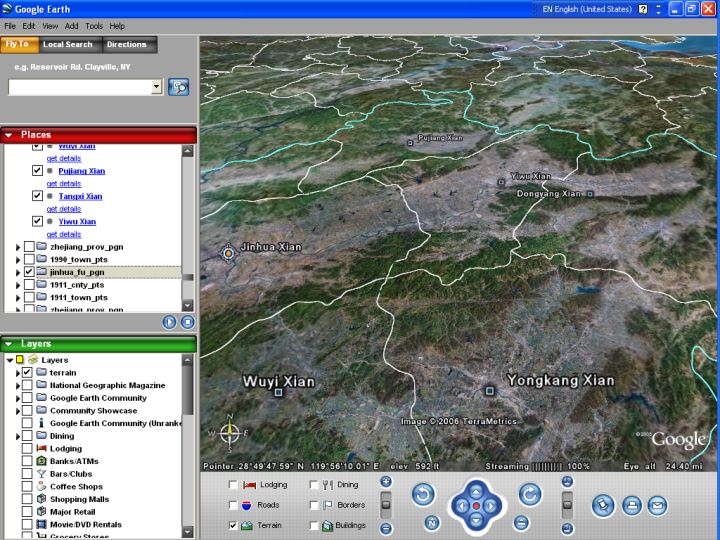
|
The source notes are of particular importance and cannot be found in any printed
historical atlas. They consist of extracts from the historical sources used to
determine administrative changes, point locations, and boundaries. Historical
texts, with bibliographic citations, are quoted directly from primary and secondary
sources in Chinese and are accompanied by commentaries in which the editors
provide written justifications for their choices. In this way the core research being
done to create the database is exposed to the users for their reference, making
use of the power of the relational database in way that clearly differentiates the
CHGIS datasets from a printed atlas, or digitized versions of a printed atlas.
For reasons discussed below, for the last millennium it is possible to add
settlements (usually market towns) outside of the hierarchy of administrative
seats to the database. CHGIS Version 1 (released Apr 2002) included 7,700
towns for the year 1820 CE. With CHGIS Version 2 (released Oct 2003) this
number increased to 8,600 towns, while an additional 17,400 towns for the year
1911 CE were added, along with 2,000 localities extracted from Russian
Historical maps. By Version 3 (released Apr 2005) the number of 1911 towns
reached 27,400, and we hope to finish the project with approximately 40,000
towns and villages of historic significance in the database. [slide 44]
Using the CHGIS datasets
Although when completed CHGIS will supersede any existing historical administrative geography of China in terms of temporal range, spatial accuracy, and documentation of sources, it is more than a mere improvement on the traditional printed atlas. I shall illustrate this in two ways, by examining what we might learn from the datasets themselves and by showing what can be learned by joining other kinds of data to the CHGIS base datasets.
Looking at administrative change
A continuous time series reveals far more information about the administrative system in the aggregate through space and time than any other usable resource. A year-by-year administrative atlas allow us to see changes in the spatial distribution of the administrative system over time, without, however, accounting for those changes. It thus has the potential for generating interesting historical problems.
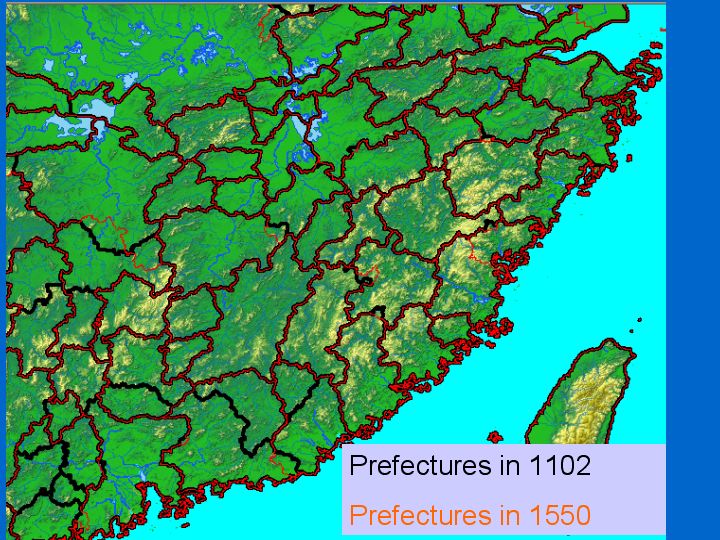
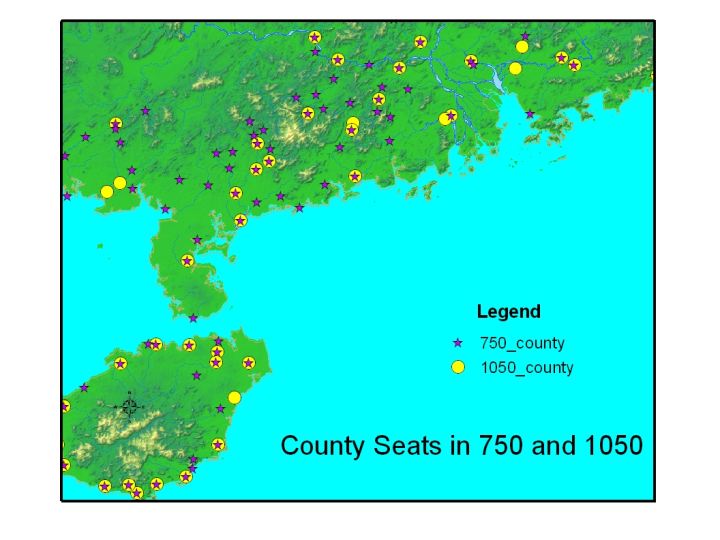
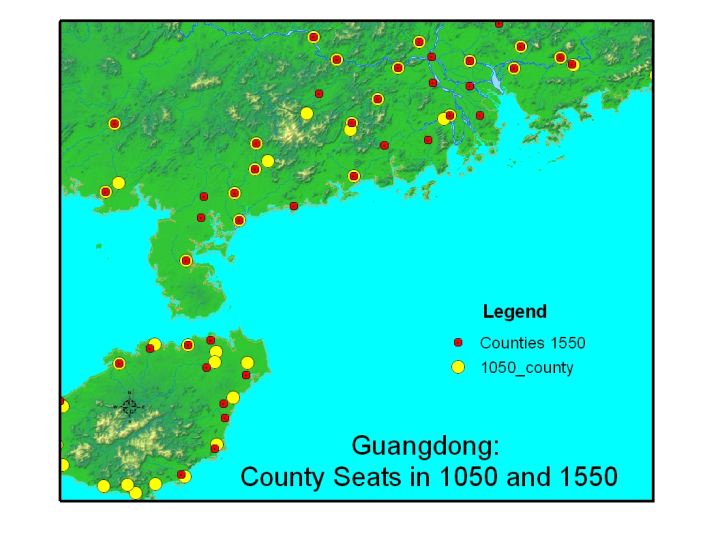
My first example has to do with changes in administrative density. In maintaining a field administration the imperial state was torn between two goals. On one hand it wanted to fully incorporate territory into the civilized realm, which required an expensive investment in civil institutions and military security. On the other hand it wanted to maximize its revenues, which required that its investment be reduced to the minimum necessary to secure a surplus that could be transported to the center.6 The basic units of the field administration (i.e. administrative units managed by officials sent from the center), the counties and prefectures, were expected to pursue both goals but at the very least they were expected to pay for themselves, even if their revenue value to the center was minimal. Thus when we see changes in the density of the field administration we know we are seeing a symptom of something. In this first case we are looking at eastern Guangdong (the Canton area) in the 8th, 11th, and 16th century [slides 45-46] and concluding that it is much more part of the early 8th century Tang state than the 11th century Song, although it becomes important again in Ming.
This only defines a problem; it does not explain very much. At first glance the explanation has to do with Canton's status as the major port for the Southeast and South Asia sea trade, where goods were offloaded and transferred to internal rivers for transport to the north. In the 11th century that role was fulfilled by Fujian ports. The shift in ports can be attributed to the Huang Chao rebellion, which sacked Canton in 879 and massacred as many as 120,000 of the 200,000 inhabitants, the bulk of whom were Southeast Asian, Indian, Persian, and Arab merchants.7 However, when we look at the data more closely we find that the decline in administrative density had begun prior to the rebellion. In fact a 13 percent decrease took place immediately after the An Lushan rebellion of 755, which sacked the capital of Chang'an. This suggests an alternative account: that an embattled court saw local government in Guangdong as an unnecessary cost. The successful attack on Canton in 879 followed a declining government presence. In any case although we can see the renewal of local government in Guangdong in the 15th century as a revival, we can also understand why its Ming inhabitants traced their history back to migration south during the collapse of the Song in the 13th century and had little sense of social continuity with Tang.8
Adding Data to CHGIS Datasets
The great promise of CHGIS lies in using it to analyze relationships in other kinds of historical data that have spatial attributes, that that can be joined to CHGIS locations.
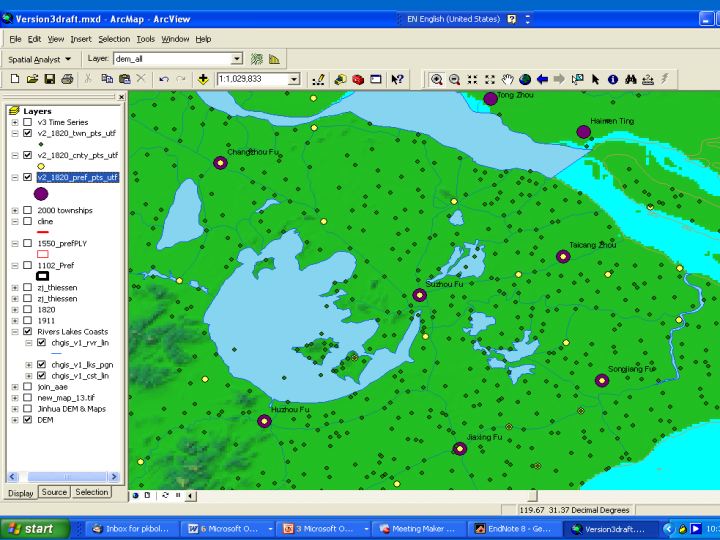
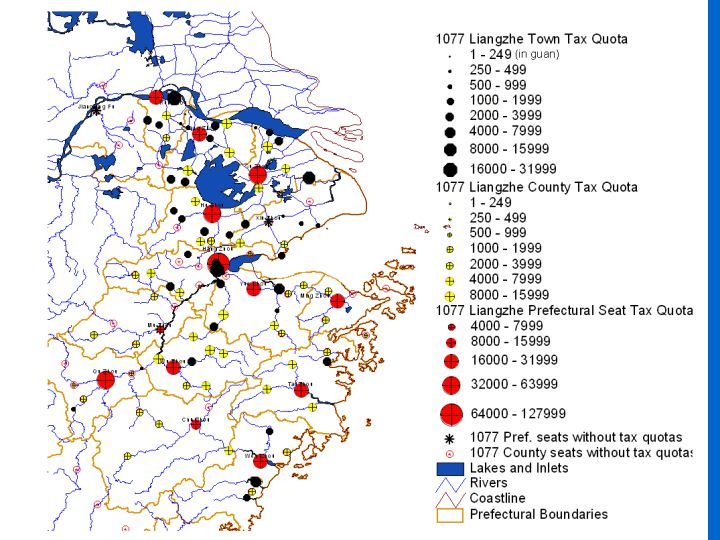
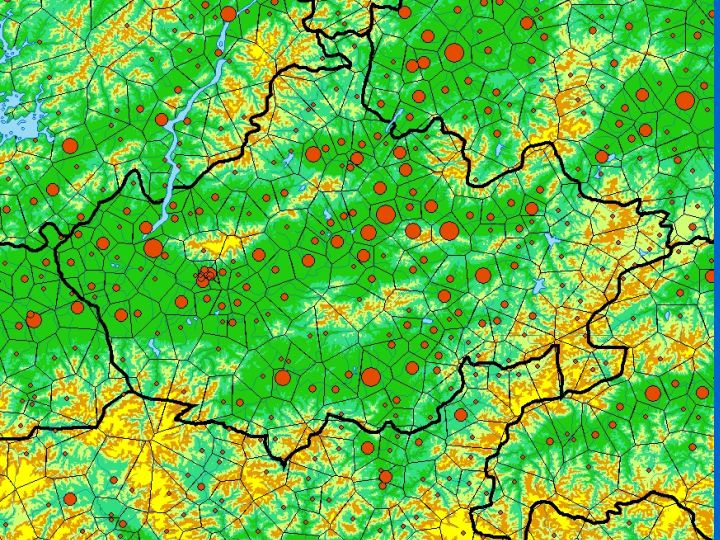
In the first case [slide 47] I have taken data on the quota assigned stations for collecting commercial tax (the transit tax of 3% of value and sales tax of 3%) in 1077 and distinguished between tax quotas for prefectural seats, county seats, and market towns in the circuit of Liangzhe (modern Zhejiang, southern Jiangsu, and eastern Anhui provinces). The measure is strings of 1000 copper cash (guan). Black symbols are used for market towns, yellow for county seats, and red for prefectural seats. Symbols of the same size represent equal amounts. We see towns with tax quotas greater than their county seats and county seats with quotas greater than their prefectural seats, and there are administrative centers with no quotas at all, indicating an absence of significant commercial activity.9 The conclusion to be reached from this is important: by the 11th century the hierarchical network of economic central places had separated from the hierarchical network of administrative seats. This was the first great commercial revolution in China's history and the moment when government learned how to tax the commercial economy instead of trying to control and command it as it had in early imperial eras.
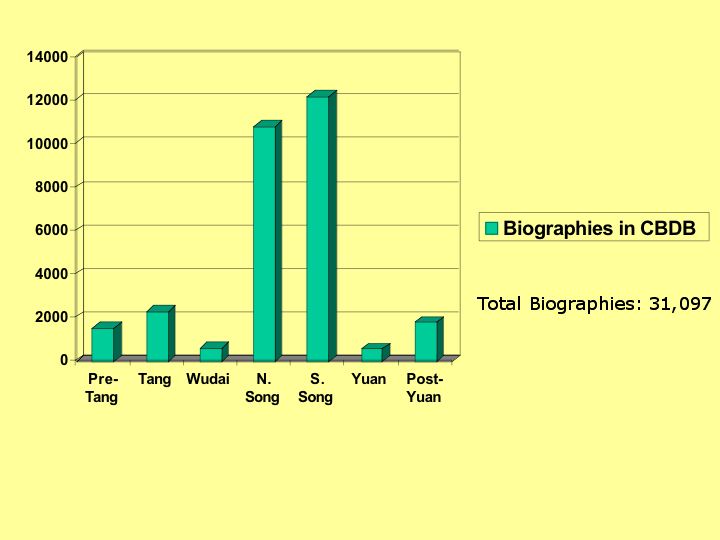
My second case draws on a prosopographical database of over 20,000 officials from the 10-13th century, [slides 48-50] including 8,000 holders of the highest civil service examination degree.10
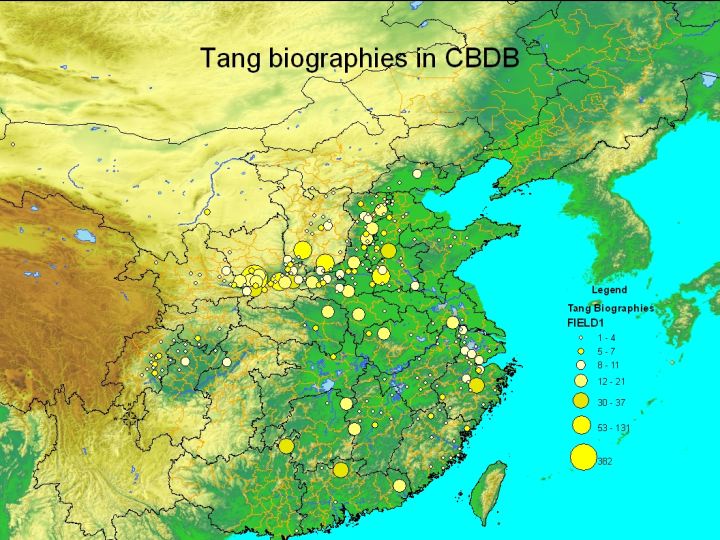
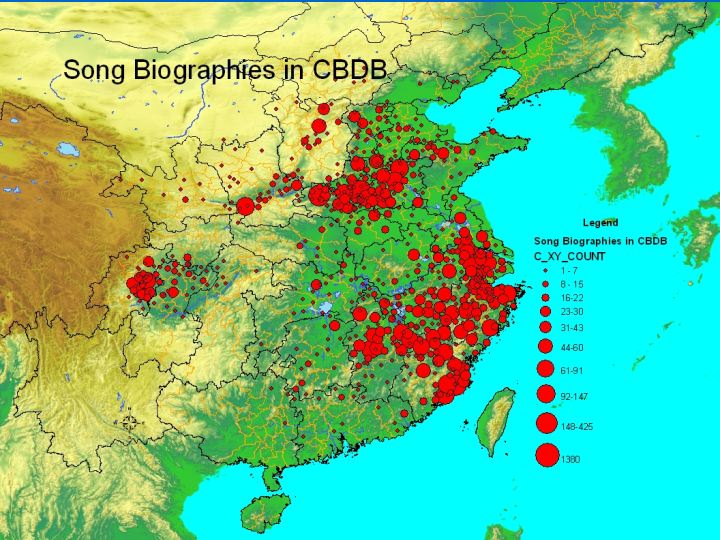
By joining these to the CHGIS datasets we can accurately depict where these officials came from and compare their spatial distribution over time [slides 51-2].
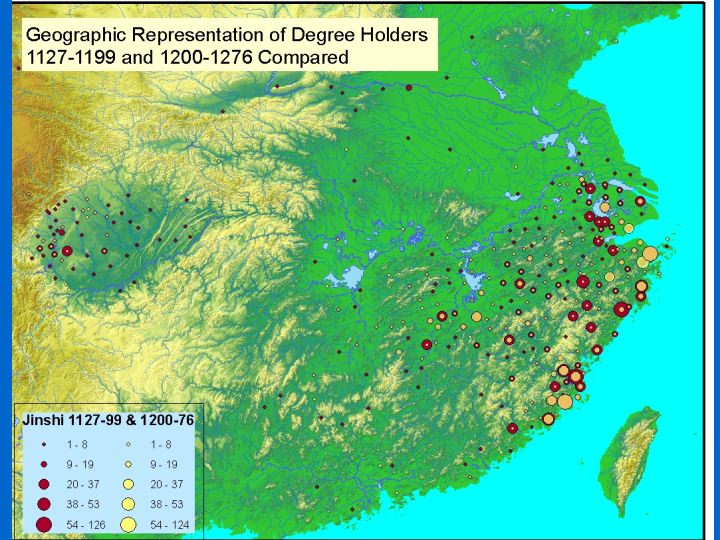
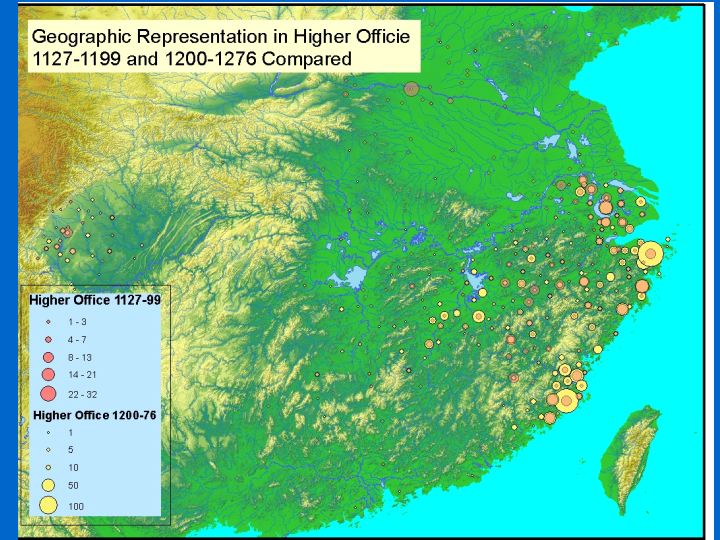
One preliminary result has not, as far as I know, been noticed: over time the geographic representativeness of the higher echelons of the bureaucracy (i.e. those people whose biographical details were most likely to be preserved) narrowed to the point that three circuits dominated the government (Liangzhe, Fujian, and Jiangxi) just at the point that the Mongols were gathering power (they took north China from the Jurchens in 1234 and successfully invaded Song in the south in 1270) and the Song government was trying (ultimately without success) to increase its access to the fiscal resources it needed for national defense.
In all these cases I have been employing the most basic GIS techniques: querying the database by year, joining data, and arriving at a preliminary analysis by looking for patterns in the mapping of the data in time and space. Even at this unsophisticated level one of the contributions of GIS is apparent: it allows us to keep track of large quantities of data and to see them simultaneously in relationship to each other. Statistical analysis could have done much of this - and indeed the next step would be to quantify some of these findings - but some of it would have required deriving information from a map. More fundamentally, I think GIS provides an inducement for historians to give more attention to thinking spatially: to see space, like time, as a "conceptual and analytic framework within which data can be integrated, related, and structured into a whole"; to store structured data in forms that others can share and analyze; and interpret and explain spatially structured information.11
Spatial Ontology in Historical GIS
However, if we are to use GIS in history we need to ask how our conceptualization and representation of space in the present relates to past ways. This is a problem of spatial ontology. I shall treat one aspect of this, the "points versus polygons" question, which is fundamental to the way CHGIS represents the administrative hierarchy. CHGIS provides "points" for up to seven levels of administrative seats; it provides polygons for the counties in 1911 based on mathematical cartography but also for the prefectural level units throughout history. For the first millennium of imperial history the roughly 300 prefectures were the most important units in the field administration as they mediated between the capital and the roughly 1,200 counties.12
CHGIS depicts prefectural units as territorial units with clearly marked boundaries [slide 53].
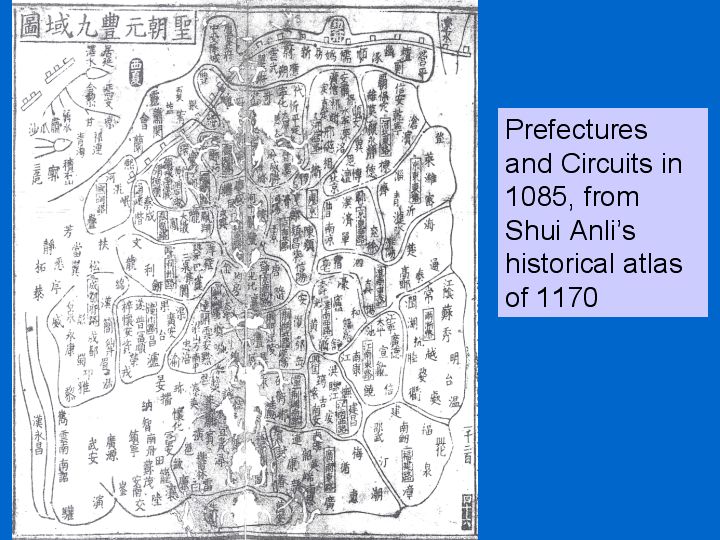
In my view this is anachronistic and misleading for too much of Chinese history. In China, from early times, the administrative seat defined the administrative unit, rather than a clearly bounded territorial unit. In the United States, administrative units are likely to have names different from the town in which the administrative seat of government is located. But this has not been the typical assumption in China's history. To illustrate: if the state of Nebraska were in China its administrative seat would be called Nebraska, we would be meeting in Nebraska rather than Lincoln and, as we see on all early Chinese maps and read in early historical sources the state would be depicted as a point location on the map not as a polygon. In China the national capital was the seat of the court, the center of power and wealth, and for much of history a planned city. It was the "pivot of the four quarters," standing against the uncultivated wilds; just as the light of the "son of heaven" in the central plain was in the midst of the forces and deities in the darkness of the surrounding mountains.13 Administrative capitals replicated this notion of centrality. The depiction of administrative units, which obviously had jurisdiction over surrounding villages, is evident in these 11th-12th c. maps [slides 54-55] where the prefectures are named points rather than territories.14
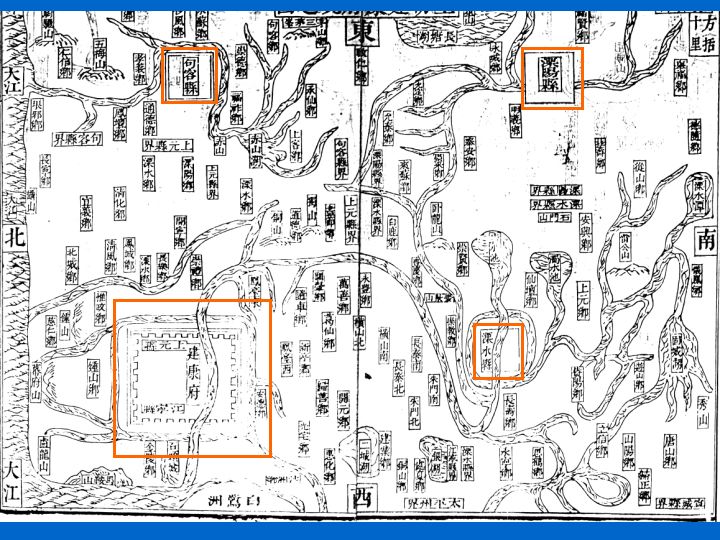
This was not because a national map of limited size impeded the depiction of boundaries. Surviving county and prefectural maps from the thirteenth century represent prefectures and counties as administrative seats. An example from 1261 [slide 56] depicts physical features (mountains, rivers, lakes) graphically and the prefectural and county seats planimetrically, as square, enclosed cities. The subcounty administrative units (the "township" or "canton" xiang, territorial units without fixed seats) are merely labeled.
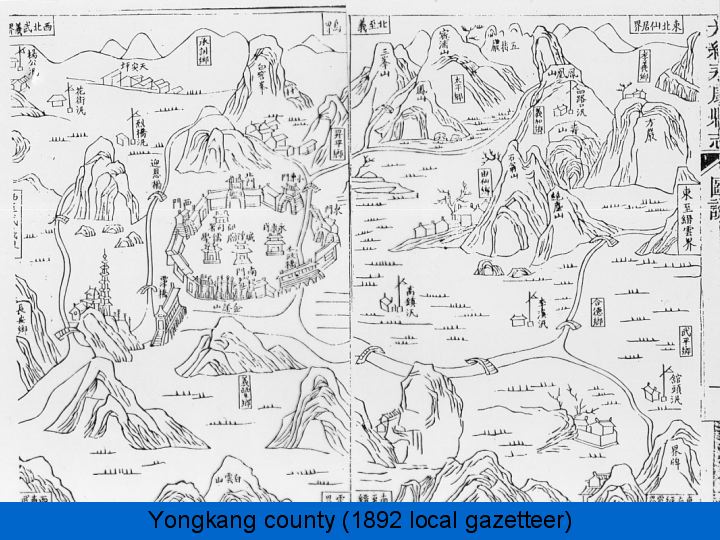
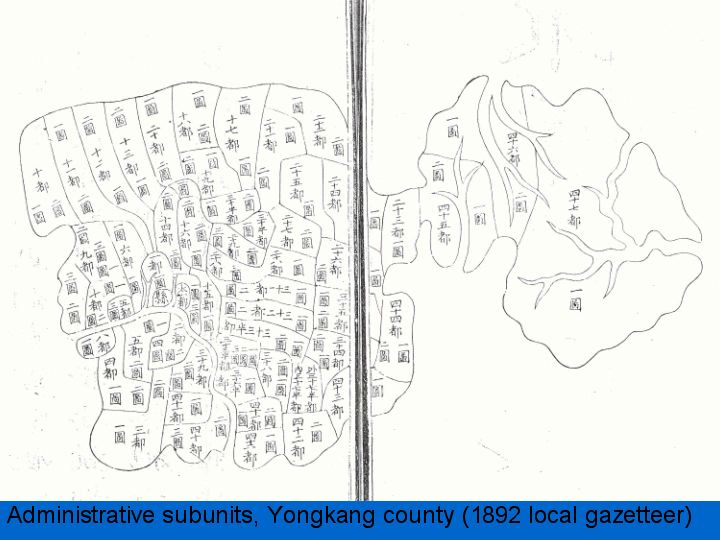
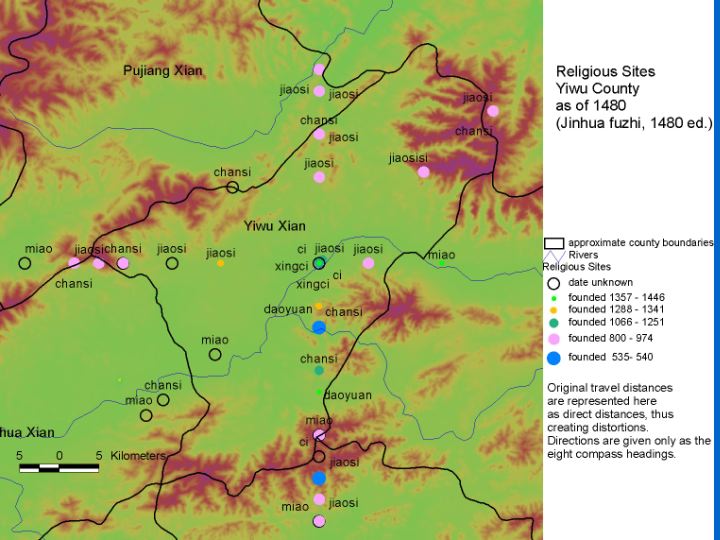
The difference between this traditional style of square map and a much later addition to the repertoire, the map that depicts an administrative unit as isolated bounded territory, is evident in these examples, which come from the 1892 edition of a local gazetteer. Here [slide 57] is a traditional page-filling square of a county: it shows the seat and physical features and labels of subcounty cantons. It characteristically magnifies the county seat and locates the county relative to the surrounding counties by cartouches along the perimeter at the eight compass points (N, NE, E, etc.), reading "north to Yiwu county," and so on. The other map [slide 58], from the same source, shows roads connecting villages to the county seat, but for the first time in the case of this county represents the administrative unit as bounded space.15
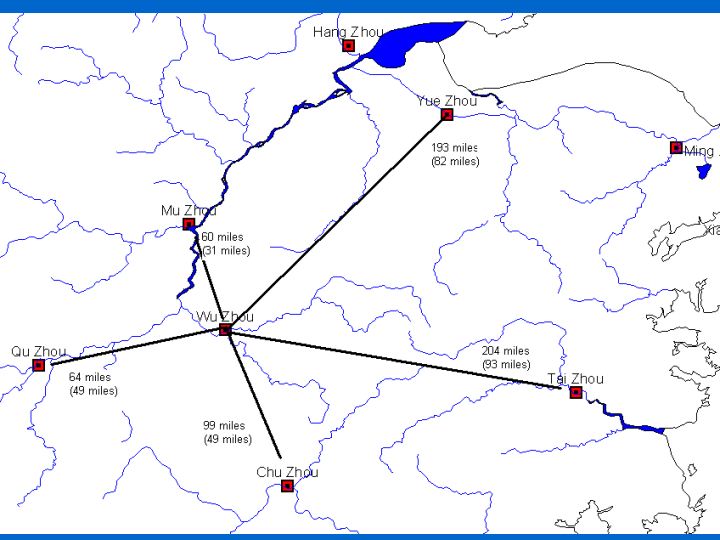
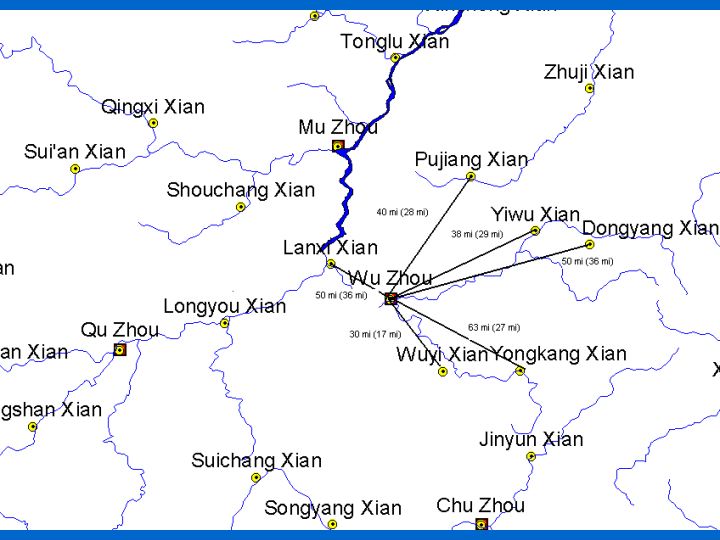
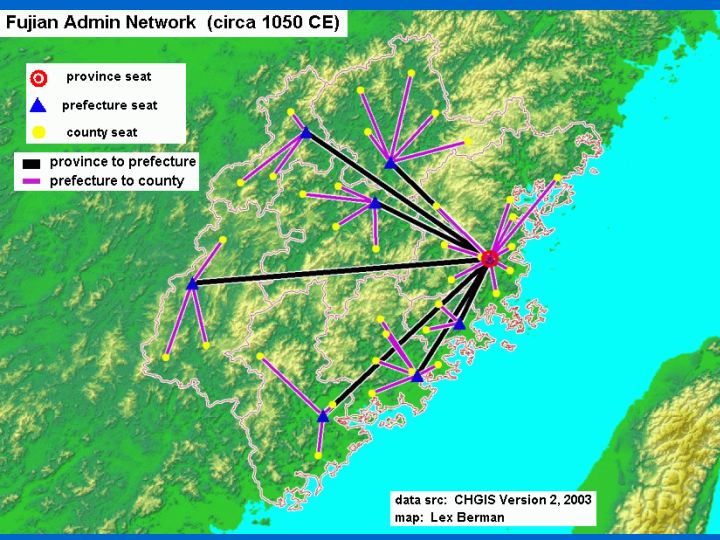
Although there were precedents, depicting the county as an isolated bounded territory becomes popular in the nineteenth century and is probably due to the influence of European cartography.16 The traditional sense of a hierarchy of administrative seats has continued in China. Even today, a villager likely sees the village as subordinate to the county, by which the county seat is meant, rather than as being "in" the county.17 The administrative hierarchy to which a given settlement belonged mattered because the government saw itself as governing through a hierarchy of administrative centers. And this is how traditional geographies such as Li Jifu's Maps and Treatises on Commanderies and Counties in the Yuanhe Reign Period from 806-814 and Wang Cun's Treatise on the Nine Regions in the Yuanfeng Reign Period from 1078-85 conceptualized the administrative hierarchy.18 They treat administrative units as points in space, giving the direction and distance from the prefectural seat to surrounding prefectural seats and from the county seat to the prefectural seat [slides 59-60]. The appropriate way to represent this would be as a hierarchical system of networked points [slides 61-62].
Chinese historians and administrators could conceive of boundaries and of space as bounded territory. Beginning in the eleventh and twelfth centuries greater attention came to be paid to the territorial extent of prefectures in both geographies and maps.19 Nevertheless, although surveying techniques for measuring direct distance were known,20 extant maps and geographies did not yet attempt to depict or describe administrative units as bounded space. The focus on the administrative seats where officials sent from the center resided, the limited resources of government, and above all the nature of the tax system, which registered population first and land second, help explain the lack of interest in delineating administrative boundaries. Land parcels were measured and their productivity assessed in order to assign the tax burden of each parcels.
However, there was variation across regions: in the north China plain into the eighth century, land was tracked for the purpose of the equitable distribution of lands to taxpayers, whereas this appears not to have been done in the south.21 And there was temporal change: as land came to be redistributed through the private market in all regions in the late 8th century, the tax system graded households by wealth and collected land tax from the owner of each parcel. However, correlating the land registers with the population registers depended on recording all land transactions or regular cadastral surveys, neither of which happened. Land registers could have provided a basis for defining administrative units as bounded territory, but only if all land was farmed in some fashion and made tax-worthy. Thus although the idea of creating maps from the bottom up to serve as an integrated guide to land and population did occur to some there is no evidence that such a system was put into effect.22 Given the private market in land, over time the land held by households in a given registration group would change so that to depict their registration unit as bounded space would make it even more difficult to collect taxes. This suggests that unless there were natural barriers such as rivers or mountain ranges which created clear lines of jurisdiction, people at the time thought of the territorial boundaries that divided administrative units as flexible zones. From an administrator's perspective the real question was whom he had to collect taxes from. He had to know which settlements fell under his jurisdiction and what property was held by the inhabitants of those settlements; he did not need absolute boundaries.
Most prefectural and county gazetteers, which began to appear in large numbers in the twelfth century, remained oriented toward the administrative seat, locating mountains, bridges, reservoirs, markets, and religious sites by direction and distance this one central point [slide 63].
Although some argued that the county should be treated as a physiographic spatial unit rather than as a series of points networked to the administrative seat, this did not become the dominant view until the nineteenth century under the influence of European surveying techniques and cartography.23 Although contemporary cartography follows the Western style of depicting units as bounded space, the government is only now systematically using modern surveying techniques to define county boundaries exactly.
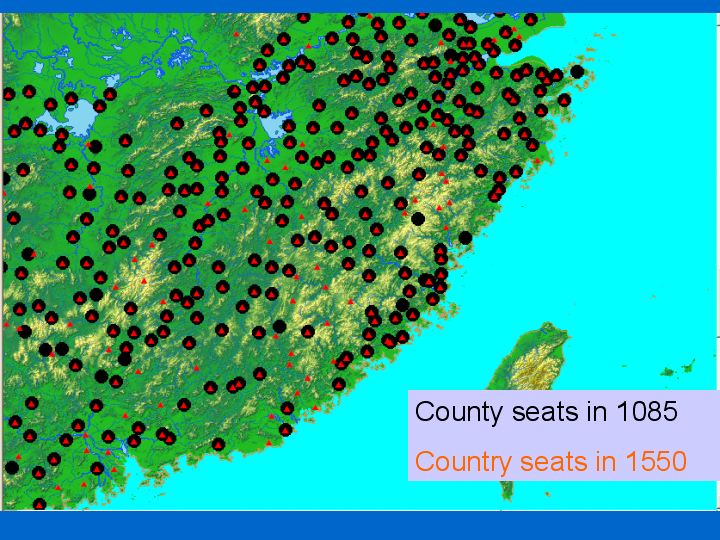
This suggests to me that by depicting the administrative units as bounded territory we are misconceiving the relationship of the imperial field administration to the land and population. For the first 1000 years of imperial history, and well into the last 1000 years for certain regions, we might be better served by thinking of the administrative hierarchy of the Chinese empire as a colonial administration, sent out into the countryside in search of revenue and plunked down in the midst of the natives, to whose local elite it offers the opportunity of participation in the imperial project. From this perspective the administrative seats are outposts, strategically located at transportation hubs (where rivers meet) that divide up the arable (and thus taxable) land between themselves. In fact the location of county seats in the south follows this model fairly well [slide 64].
What does change—and I think this points in the direction of a new spatial consciousness which starts to see administrative units as bounded territory as well as networks of central places—is the emergence in the twelfth century of elite communities with a high degree of local identity through much of the south. As they begin to play a larger role in the life of the locality and learn how to influence local officials, the colonial character of local government dissipates. One sign of the de facto joint government of local elites/local officials is the spread in the twelfth century of the "local gazetteer," a history and survey of a county or prefecture that the local government and local elites compiled together. Local gazetteers have extensive information on local elites, as well local government, religious sites, markets, population, and physical geography and infrastructure. The local gazetteers are practically all data—the challenge is to extract the data in formats that allow for large-scale spatial analysis.
However, despite these objections, the historical geographers working on the CHGIS project have been spending a great deal of time creating prefectural boundaries or polygon layers, despite the fact that for the first 1000 years of the database these boundaries simply do not have the same meaning that they do for the second millennium. By doing this we have certainly created false certainty—the boundaries simply cannot be identified with such exactitude—and I fear we have given a fundamentally misleading impression of the process by which the field administration and the empire operated. The justification for creating boundaries, however, is that they have heuristic value: users expect to be able to do density analysis and even if the boundaries are highly inexact they serve this purpose.
Approaches to Density Analysis in an Historical GIS
A GIS that extends its temporal scope beyond coverage of accurate historical maps will inevitably face the fact that we lack reliable information on boundaries even if they ever were well defined (settlement points are much easier to establish). What, then, should we do?. Here GIS technology can be of great help. I shall illustrate this with two applications of GIS software. The first generates heuristic boundaries for density analysis based on point data, boundaries which can be refined as more point data is added to the database. The second creates density analysis that does not normalize by the area of the administrative unit but takes into account the uneven distribution of population and activity across a landscape of mountains, plains, valleys and lakes.
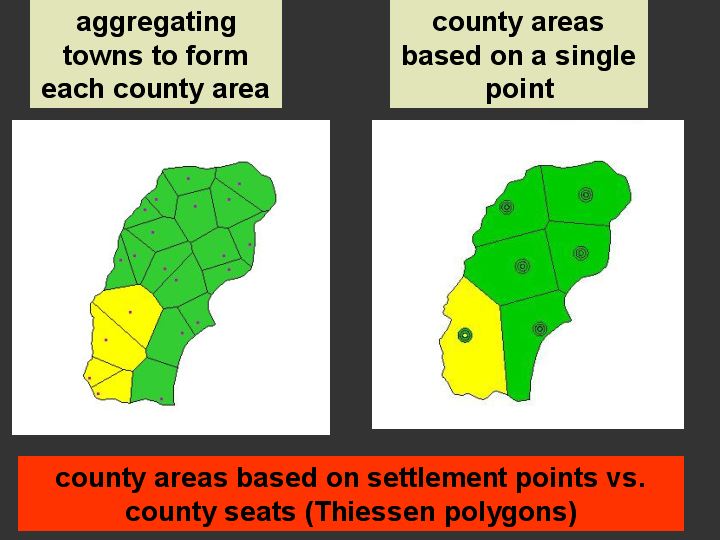
Creating Heuristic Boundaries with Thiessen Polygons
Let us suppose that we have no information on boundaries at all, but that we know the point locations of administrative seats. The simplest way of approximating boundaries is to assume that all boundaries are equidistant between two points. The resulting polygons are known as Thiessen polygons. The results are very rough indeed, as we see in this case of counties in a prefecture [slide 65]. However, we also know the point locations of a few towns within each county. When we generate Thiessen polygons using this data the boundaries become more complex.
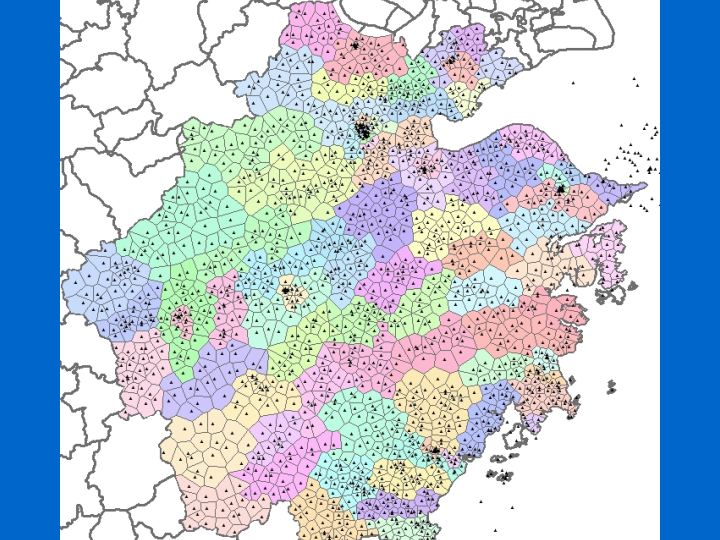
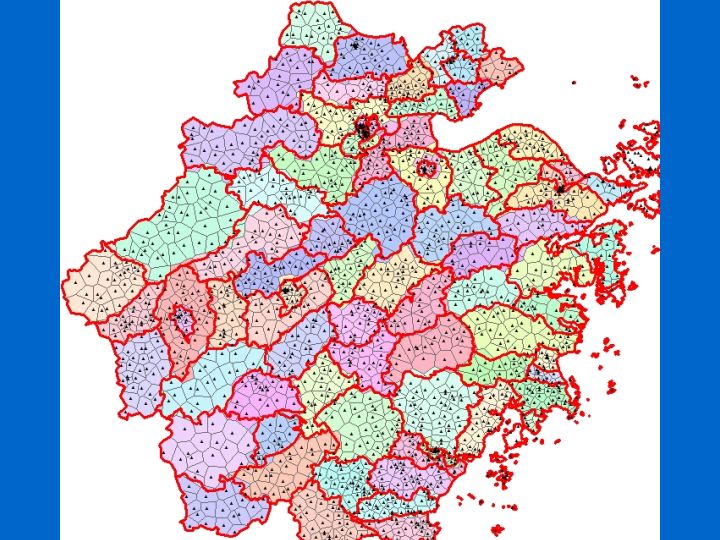
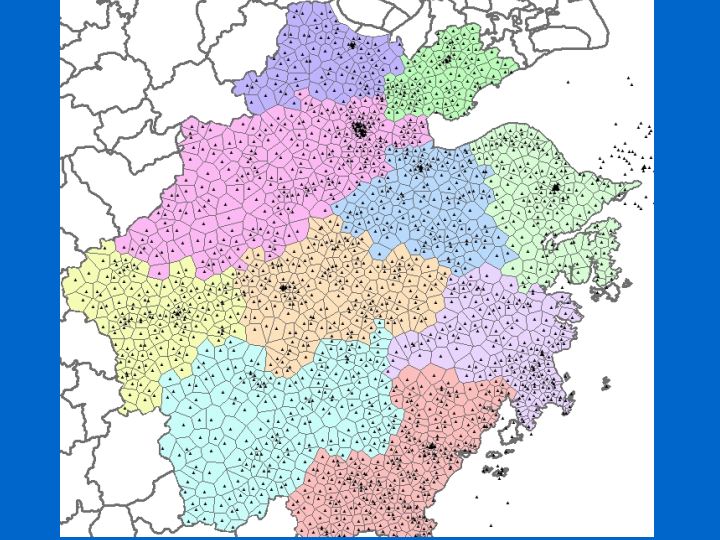
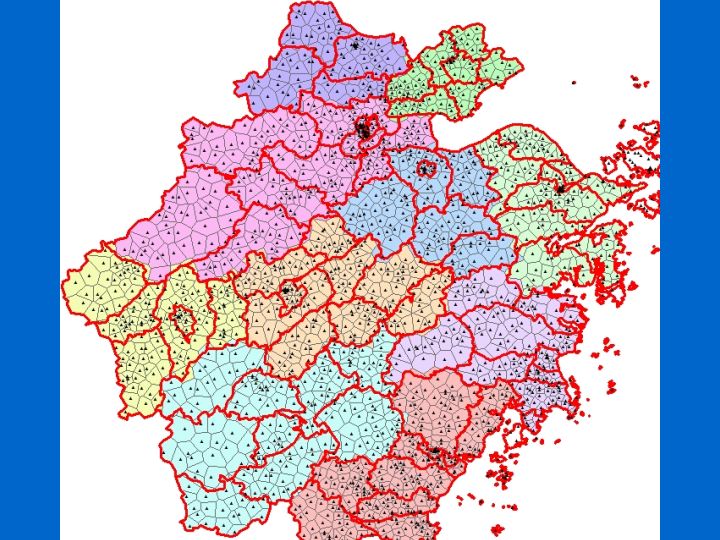
Here we apply this approach to the province of Zhejiang. Thiessen polygons are generated for the entire province, based on the locations of townships, and color coded by county [slide 66]. We then compare this with the actual county boundaries as of 1990 [slide 67]. We see that well over 90% of the county territory is accurately defined with Thiessen polygons. When we aggregate up to the prefectural level the accuracy is even higher [slides 68-69].
Thus rather than spending time producing boundaries our resources could better be devoted to adding market and settlement points. Chinese local gazetteers identify the location of markets. Since the gazetteers have been revised and updated every century or so we can show that markets persisted once established, even if we can rarely be sure of the date of establishment. Here I have located markets from the fifteenth through the nineteenth century on a gazetteer map [slide 70].
Density Analysis in Real Landscapes
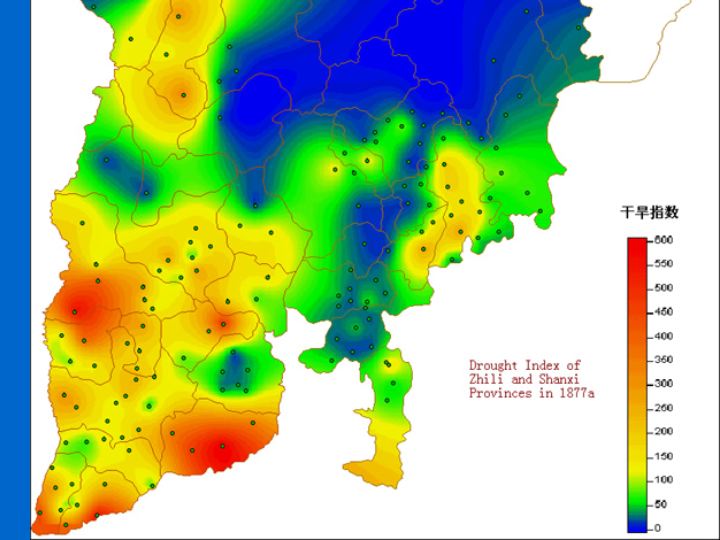
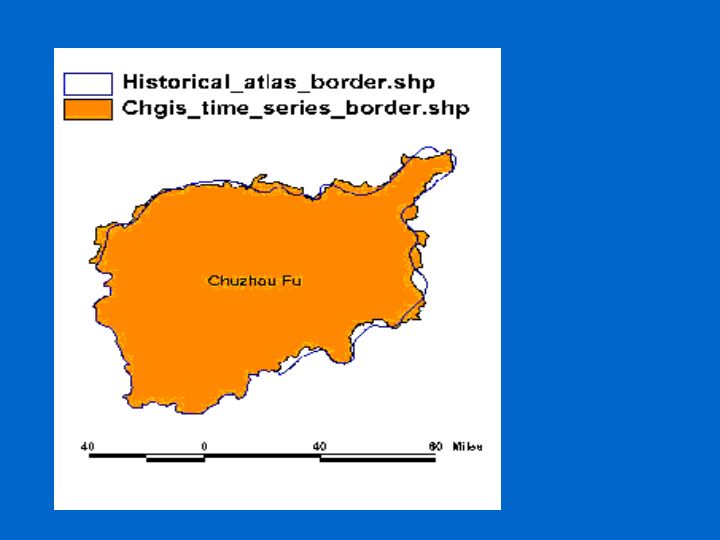
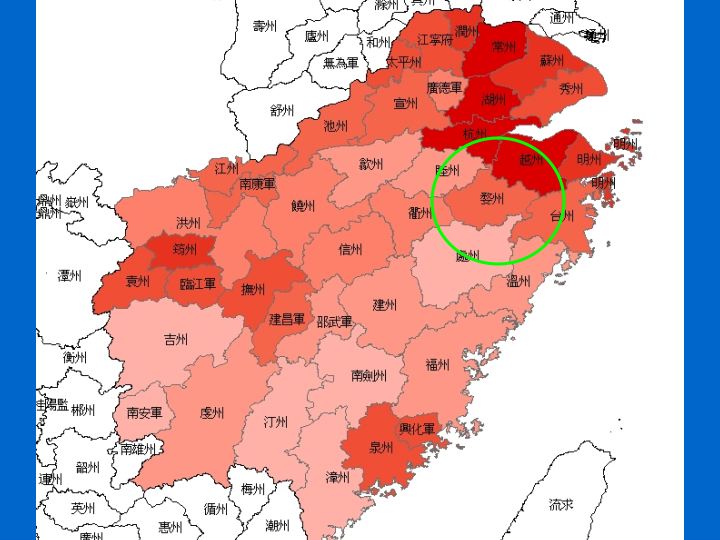
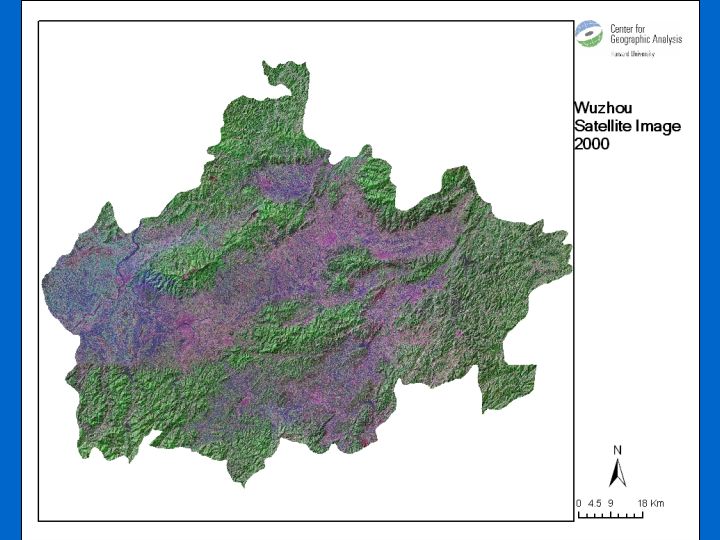
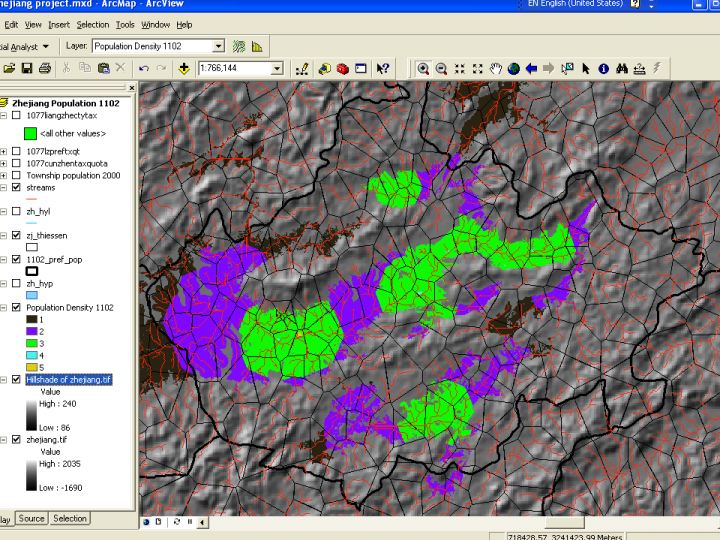
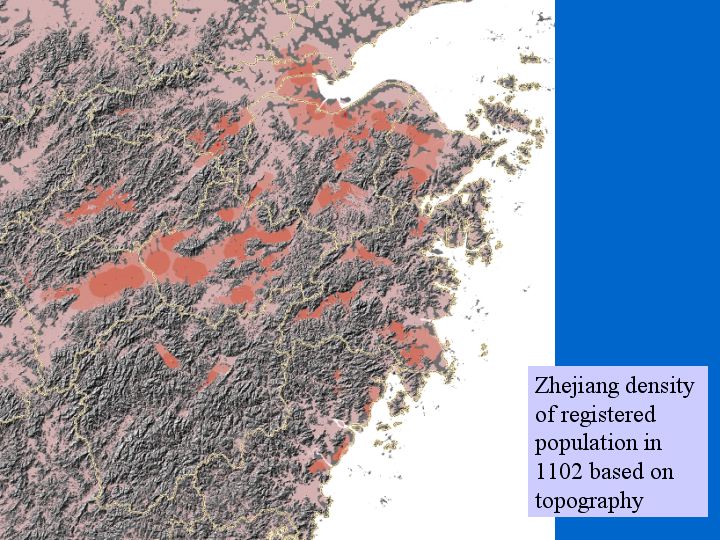
Simple density analysis normalizes data by area. In this example I have taken the registered household population for the Zhejiang area as of 1102, given in the sources as a prefectural aggregates, and represented density on a chloropleth map based on CHGIS prefectural polygons. [slide 71] As expected the population is most dense around the Hangzhou Bay and north to the Yangzi River. However, taking the circled prefecture as an example, we can see from remote sensing imagery [slide 72] that the population was not spread uniformly across the landscape, which means that the kinds of human activity that historians tend to study were in fact concentrated in about half of the prefectural area.
We have registered population data for China going back to AD 2 (60 million). Much of this is only at the prefectural level. We would like to distribute this population across the landscape as background to other data layer on land use, taxation, warfare, education, etc. Given that the level of aggregation is the prefecture, we want to do this automatically but with a high degree of reliability.
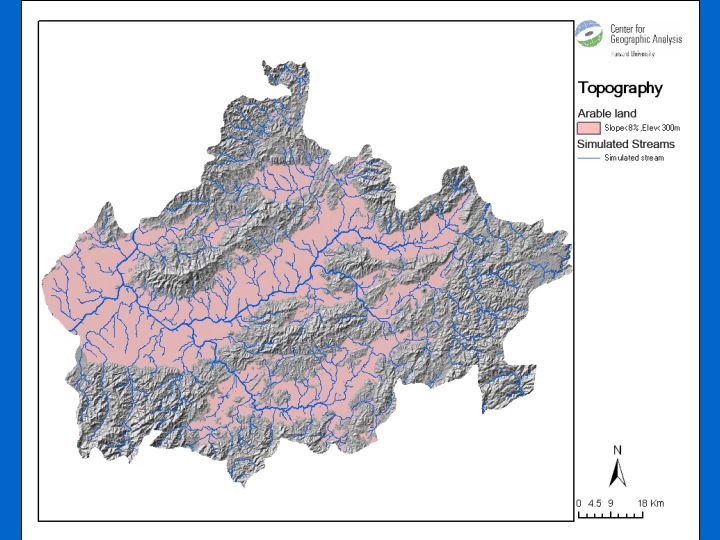
Guoping Huang of the Center for Geographic Analysis at Harvard and I have developed a model for historical population distribution. The model makes certain testable assumptions: that people will congregate on arable land with less slope, that they need access to water for agriculture and cheap transportation, and that larger settlements will emerge at the conjunctions of rivers. We began with a "digital elevation model" of Zhejiang province [slides 73-74].
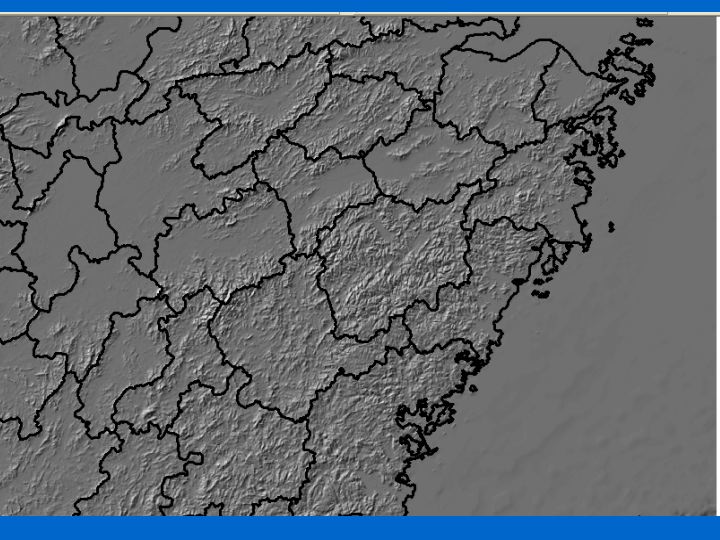
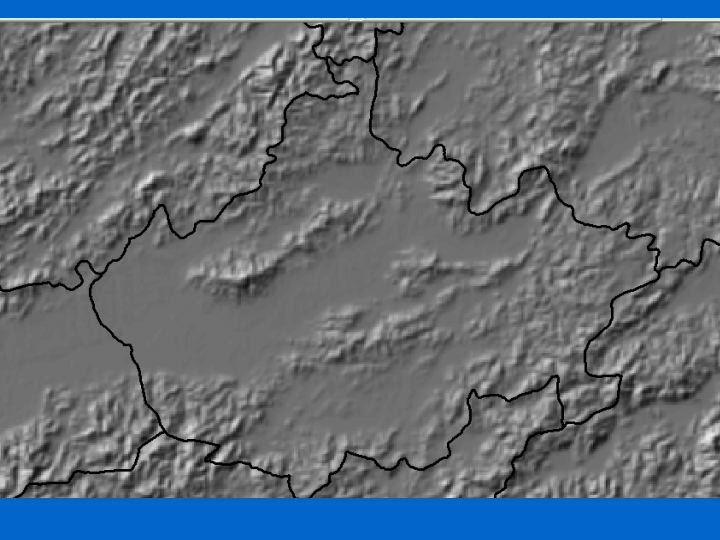
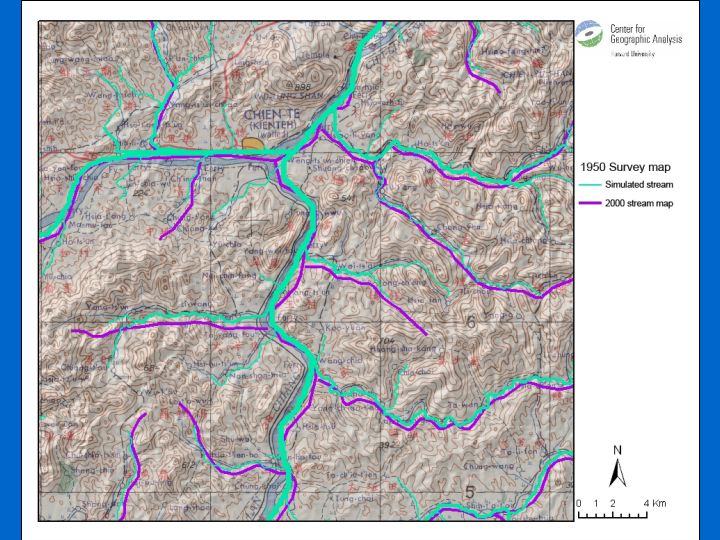
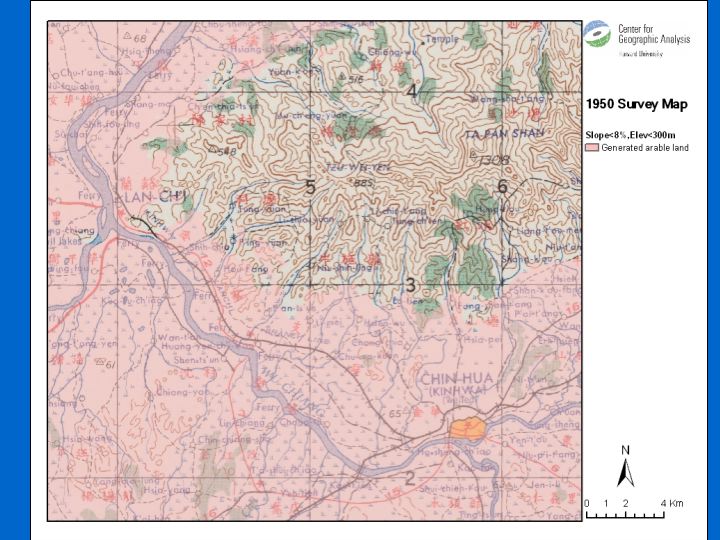
Using a DEM, seen here as "hillshade," GIS software can measure slopes and determine where rivers ought to be, moreover it can define the relationships between these rivers (the "Strahler order" of the degree of tributary status) [slide 75]. The accuracy of the result was tested against two sources: a 1:250K paper map from ca. 1950 (US Army Map Service) and a digital database of streams from 2000; the simulated hydrography is more accurate than the digital database. The next step was to identify land that could support intensive farming. Here we took a general expectation that farm land would have a slope of less than 8°. We tested this against the land use data in the 1950 maps and were satisfied with the accuracy. [slide 76]. This gave us the basic information [slide 77].
We then assumed that population would be concentrated in the arable land thus defined, that it would tend to congregate around river intersections and around prefectural and county seats. [slide 78]. Based on this model we suppose that the density of the registered population in 1102 for this prefecture looked something like this. To test the predictive power of this model we tested it against population data by township from 2000. The result [slides 79-82], supports the conclusion that our model can be relied upon to give us a population density with a high degree of accuracy.
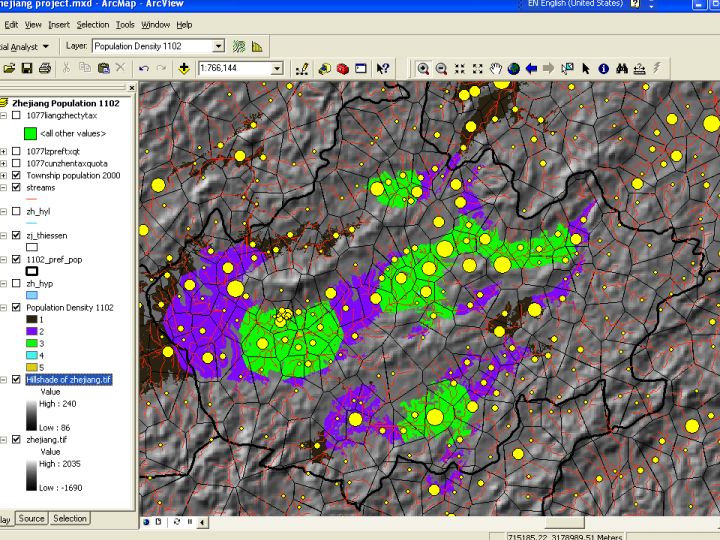
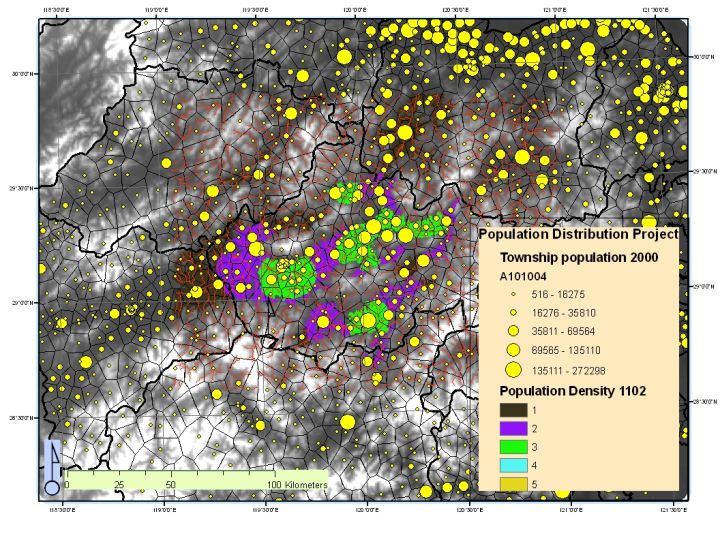
And since most human activity follows the population, we have now have a map which shows where most of China's history took place. We are currently extending the application to the province of Zhejiang, but the ultimate intent is to do this for the core areas of China so that all available demographic data can be displayed [slide 83].
Some Suggestions
The creation of large-scale historical GIS promises to provide historians with a framework for organizing and analyzing the very large amount of historical data that has spatial attributes. Short of a major infusion of financial support creating these historical GIS will be a long term project. I suggest we think of them as the equivalent of the creation of databases of historical texts. And once they are done they will be available for all to use. Another possibility is under development (although it requires rich gazetteers with sufficient temporal information. This is to spatially enable statistical datasets so that they can be filtered through the gazetteer and represented on a map. In either case it seems to me that we need to think beyond "national" historical GIS and think in regional if not world terms. At the very least we need to think of the larger contexts in which historical polities existed rather than reading nation state of modern history, and its concerns with national sovereignty and identity, back onto the past.
1 Knowles, Anne Kelly, ed. Past Time, Past Place: GIS for History. (Redlands: ESRI Press, 2002). Knowles and Amy Hillier are currently editing a second volume selected from papers from the conference on "History and Geography: Assessing the Role of Geographical Information in Historical Scholarship," Chicago, Newberry Library, March 25-27, 2004.
2 Nick Chrisman, Charting the Unknown: How Computer Mapping at Harvard Became GIS (Redlands: ESRI Press, 2006).
3 Monmonier, Mark S. How to Lie with Maps. (Chicago: University of Chicago Press, 1996).
4 Collected in Past Time, Past Place: GIS for History, ed. Anne Kelly Knowles (Redlands, CA: ESRI Press, 2002).
5 Zhongguo lishi ditu ji, Tan Qixiang, ed. 8 volumes (Shanghai, Ditu chubanshe, 1982- 1987).
6 This is a central thesis in Ruth Mostern's forthcoming Apprehending the Realm: The Territorial State in Early Modern China.
7 The Cambridge History of China Vol. 3: Sui and T'ang China, 589-906, ed. Denis Twitchett (Cambridge: Cambridge University Press, 1979): 740.
8 See, for example, Miles, Steven B. Sea of learning: mobility and identity in nineteenth- century Guangzhou (Harvard East Asian Monographs): 269 (Cambridge, Mass.: Harvard University Asia Center: distributed by Harvard University Press, 2006).
9 This dataset is discussed in Guo Zhengzhong, Liang Song chengxiang shangpin huobi jingji kaolue, 229-301 and Shiba Yoshinobu ____, S_dai no toshika wo kangaeru _________. T_h_gaku ___ 102 (2001): 1-19.
10 This dataset, known as the China Biographical Database (Harvard Yenching Institute) was created by the later Robert M. Hartwell over a period of twenty years and willed to the Harvard Yenching Institute. It is currently being further developed as a web- based database by Harvard, the Institute of History and Philology at Academia Sinica, Taiwan, and the Center for Chinese History at Peking University.
11 Committee on the Support for Thinking Spatially of the National Research Council. Learning To Think Spatially (Washington, D.C.: National Academic Press, 2006): 25.
12 I have discussed this at greater length in "Putting History in Geography: The Challenges in Creating a GIS for the History of China," to appear in Placing History: How Maps, Spatial Data, and GIS Are Changing Historical Scholarship, ed. Anne Kelly Knowles (Redlands, CA: ESRI Press, forthcoming).
13 My thinking about this owes much to Sarah Jo-Shao Wang, "Out of control: The place of shanshui (mountains and rivers) in the geographical discourse of early imperial China" (Ph.D. diss. University of Michigan, 1999), and Paul Wheatley, The Pivot of the Four Quarters: A Preliminary Enquiry into the Origins and Character of the Ancient Chinese City (Chicago: Aldine Pub. Co. 1971).
14 This is true for all of the maps in Shui Anli's historical atlas. Shui Anli _ _ _, Lidai dili zhizhang tu _______ (rpt. of 12th c. ed. Shanghai: Shanghai guji chuban she, 1989). The original is held by the Toyo Bunko in Tokyo. Discussed in Tan Qixiang's preface. Also see Cao Wanru et al ___ ed. Zhongguo gudai ditu ji _______. Vol.1 (Beijing: Wenwu chuban she, 1990), notes for maps 94-101.
15 The representation of county units as bounded space appears for the first time in late 18th century county gazetteers for Jinhua prefecture (formerly Wuzhou, formerly Dongyang Jun), to which Yongkang belongs. See the Jinhua xianzhi (1823 ed.), Lanxi xianzhi (1888 ed.), and Pujiang xianzhi (1779 ed.)
16 For the adoption of European methods see Iwo Amelung, "New Maps for the Modernizing State: Western Cartographical Knowledge in Late 19th Century China," in The Power of Tu, Graphics and Text in the Production of Technical Knowledge in China, Francesca Bray, Georges Métailié and Vera Dorofeeva-Lichtman eds. (Leiden: Brill, forthcoming). As Zou Zhenhuan points out in his authoritative study of Western geography in China, Western knowledge introduced in the late Ming did not have a transformative impact; see Zou Zhenhuan ___, Wan Qing xifang dili xue zai Zhongguo: yi 1815 zhi 1911 nian xifang dilixue yizhu de zhuanbo yu yingxiang wei zhongxi __________:1815_1911________________ (Shanghai: Shanghai guji chuban she, 2000).
17 E.g., Henrietta Harrison, "Village Identity in Rural North China: a Sense of Place in the Diary of Liu Dapeng," Town and Country in China: Identity and Perception, David Faure and Tao Tao Liu eds., (Houndsmills: Palgrave, 2002), 85-106.
18 Taking the section on Wuzhou as an example; see Li Jifu ___, Yuanhe jun xian tu zhi ______ (Wuying dian ju zhen ban ed.), 27.4b-7a, Yue Shi __, Taiping huanyu ji _____(1793 ed.), 97.5b-10b. Wang Cun __, Yuanfeng jiuyu zhi _____ (1784 ed.), 5.16a-b, and Wang Cun __, Yuanfeng jiuyu zhi _____ (1784 ed.), 5.16a-b.
19 Wang Cun, Yuanfeng jiuyu zhi (Beijing: Zhonghua shuju, 1984), 5.212-19, a national administrative geography from 1078-85, for the first time gives distances from the prefectural seat to the border of the adjoining prefecture. The overview maps of Jiankang prefecture from 1261 depicts the prefecture and county seats graphically and labels boundary points between counties, see Zhou Yinghe ___, Jingding Jiankangzhi_____ (1809 ed.). In both cases I assume that the distances and points are given with reference to roads between administrative seats.
20 The great polymath Shen Gua _ _ (1031-1095) argued that by using surveying techniques and 24 rather than eight compass headings it was possible to measure the "as the bird flies" distance between points. The value of this, he claimed, was that with a table of directions and distances a scaled map could be drawn when necessary. See Needham, Science and Civilisation, vol. 3, 576, and Yee, "Cartography in China," 113- 17.
21 Frank Leeming, "Official Landscapes in Traditional China," Journal of the Economic and Social History of the Orient 23, Pt. I-II (1980): 153-204, uses 1:50K and 1:100K maps to argue that road systems reveal the system of land allotments in the North China plain according to the Tang "equitable fields" land redistribution system and an underlying older well-field system. Leeming notes that there is no visual evidence that any such system was effected in the south.
22 See, for example, Yuan Xie _ _ (1144-1224) proposal based on integrating maps created by each unit of ten households. Song shi__ (Scripta Sinica ed.), 400.12146. Noted in Needham, Science and Civilization in China, vol. 3, 518. A similar argument is found in a late twelfth century handbook for local officials; see Zhou xian tigang ____ (Congshu jicheng ed.), 2.22.
23 For one such example, see Timothy Brook's study of the cartography of Ye Chunji, contemporary with the author of the Boluo county map in Fig. 8. Brook notes that this model was not followed until the nineteenth century. See "Mapping Knowledge in the Sixteenth Century: The Gazetteer Cartography of Ye Chunji," The [Princeton University, Gest] East Asian Library Journal 7.2 (1994): 5-32. Note that in the 1763 edition the Boluo county gazetteer reverts to a traditional administrative seat centered perspective on the county in its maps and dispenses with borders. Cf. Fig 10, a late 16th c. map that also adopts a bottom-up perspective.